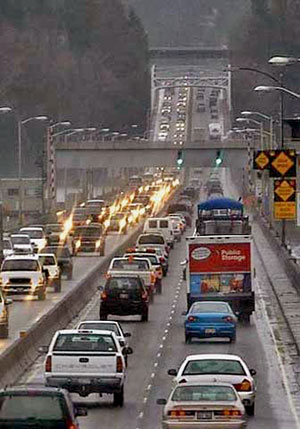
1/1/02 Traffic congestion is getting worse and transit is not helping.
Analysis of 2000 Census data by Randall OToole of the Thoreau Institute (www.ti.org) reveals that Americans are turning away from transit and increasingly using automobiles to satisfy their mobility needs. Between 1990 and 2000, passenger-miles traveled by car increased 30% nationwide, while transit increased only 16.1%. This means that the $70 billion spent on new transit systems did nothing to help traffic congestion.pan>
In Denver, highway use increased 39 times more than transit use. If the current plan to divert nearly 60% of transportation funding to transit over the next 20 years is not reconsidered, mobility in Colorado will suffer greatly.
Nationwide, transit continues to carry a small portion of all trips. On average, transit carries 2% of all urban travel. In Denver, transit commands 1.4% of the market, and only 4.3% of all commuters.
Transits greatest benefits are for commuters, but auto use by commuters has outpaced transit. Nationally, the number of commuters riding transit to work declined. However, the number of American jobs has grown by 13 million, an increase of 11%. These new commuters are not using transit to get to work, which means transit isnt relieving rush-hour congestion. Flextime and telecommuting that cost taxpayers nothing yield more traffic congestion relief than the massive expenditures for transit.
Despite low performance, transit is well funded. In the last nine years, transit agencies nationwide have spent $70 billion dollars on capital projects and $186 billion for operating expenses, but collected only $72 billion in fares. Thus, transit seems doomed to never ending dependence on heavy taxpayer subsidies.
Transit advocates point to the amount of non-user based fees spent for auto travel, as logic that others should pay their travel. In 2000, roads and transit received subsidies of $22.4 billion and $23.5 billion respectively. But passenger-miles traveled on transit are about one percent as much as by auto. Therefore, subsidies per passenger-mile are one hundred times greater for transit than for auto users!
Moreover, transit worker productivity has declined as much as 19% since 1990. This decrease in output is primarily the result of diminishing transit use. As transit agencies gain more funding, taxpayers and users get less for their dollars.
Despite the apparent failure of transit in general, one type shines through as a clear loser: light rail. In 2000, light rail used 10.9% of capital funding, but carried only 2.8 % of transit riders. Thats 2.8% of transits 2.5%, or 0.07% of all trips.
Over the last decade, the trend is even more apparent. Since 1992, transit agencies have spent twice as much on rail as buses, yet buses continue to carry the vast majority of transit trips. Even though transit agencies throw money at light rail, it remains an inconsequential part of transit service.
Rail also under-performs at the fare box. The average bus fare is 77 cents, but the average light rail fare is 57 cents. Does this mean that light rail fares must be lower to attract users or that agencies have exaggerated ridership? In either case, light rail's low fares and high expenses result in the need for greater subsidies. Light rail requires 2.5 times as much subsidy as buses per user and 250 times as much as autos.
Light rail fails because it cannot be targeted to a particular type of urban area. In high-density cities like New York, Chicago, and Boston, heavy-rail and commuter-rail systems work more efficiently than light rail, and buses work better everywhere else.
With the release of Census data, there isnt much for transit advocates to celebrate. Transit continues to occupy an extremely small role and even where transit has grown, its numbers are dwarfed by the growth in highway use. Transit is grossly over funded and hugely subsidized, even as worker productivity declines.
Over the last 2 decades virtually every aspect of American society has been pressed to provide more service at less cost. The 2000 Census reveals that transit is isolated from this trend. Transit agencies spend disproportionate and shocking amounts of money on obsolete technologies like light rail, without realizing that the current central-control approach is incapable of significantly helping to solve transportation problems.
The sooner policy makers come to grips with the difficult and unfortunate reality of failing transit, the sooner policies that improve mobility and reduce costs can be embraced.
INDEPENDENCE INSTITUTE is a non-profit, non-partisan Colorado think tank. It is governed by a statewide board of trustees and holds a 501(c)(3) tax exemption from the IRS. Its public policy research focuses on economic growth, education reform, local government effectiveness, and Constitutional rights.
Transportation
Monday, March 10, 2008
Light Rail too expensive for too few passengers


Transit's Market Share Continues to Decline
January 27, 2004
The Contribution of Highways and Transit to Congestion Relief: A Realistic View
by Wendell Cox and Randal O'Toole
Backgrounder #1721
Does building freeways only lead to more congestion? Can investments in transit, particularly rail transit, help relieve congestion?
Since the early 1980s, the Annual Urban Mobility Report published by the Texas Transportation Institute (TTI)--a part of the engineering department at Texas A&M University--has helped to answer these questions by estimating traffic congestion in more than 70 urbanized areas.1 By September 2003, TTI had compiled 20 years of highway, driving, and congestion data for 75 urban areas in the United States.
Of course, not everyone agrees on the interpretation of these data. Publication of TTI's annual report is usually greeted with a flurry of press releases, reports, and counter-reports by advocates of transit subsidies, highways, and other interests. But TTI's data, while not always perfect, remained an objective and independent standard against which the claims of various groups could be tested.
TTI's first congestion study was funded by the U.S. Department of Transportation. Many of the annual updates were co-sponsored by various state transportation departments. These sponsors did not have a particular axe to grind, and no one questioned the source of TTI's funds. In 2003, however, the transfer of sponsorship to several new financial sponsors with specific public policy agendas undermined that independence, particularly after those sponsors misrepresented TTI's 2003 findings to support their own objectives.
In contrast to past practices, TTI's 2003 report was co-sponsored by the American Public Transportation Association (APTA), which represents transit agencies and transit vendors, including rail transit builders, and the American Road and Transportation Builders Association, whose members build both highways and rail transit. An APTA press release, timed to coincide with the release of TTI's 2003 Annual Urban Mobility Report,2 claimed that the congestion report proved that "more public transportation is needed to relieve traffic congestion." In fact, the Urban Mobility Report said no such thing.
The 2003 report did ask the hypothetical question of what effect eliminating public transit would have on urban congestion. While such a question might have some academic interest, TTI's answer was used to exaggerate the effects of transit on congestion.
Even accepting TTI's answer, the report did not specifically ask whether more investments in transit would relieve traffic congestion and offered no estimates of what such investments would accomplish. In an attempt to fill that gap, this paper will attempt to answer that question as accurately as possible.
Problems with the 2003 Report
To begin, however, several things about the 2003 report seem more accommodating to the interests of the new funders than is justified by the facts. Specifically:
* The report exaggerates the effect of transit on congestion by assuming that all transit riders would drive if publicly funded transit did not exist. (Many would be in carpools, for example, since 70 percent of transit riders do not have either a car or a drivers license.3)
* Without any supporting evidence, the report erroneously indicates that transit has increased its share of urban travel in the past two decades, when in fact that share has declined.
* In response to the question, "How should we address the mobility problem?" the first answer provided is "more travel options"--a euphemism among transit advocates for more government transit subsidies--even though the report provides no evidence that non-highway options can attract significant numbers of people out of their cars or that they can even be provided outside the dense urban core.4
* While in previous years the report was released earlier in the year, the 2003 report was not released until September 30, the day that congressional authorization for federal transportation funding expired, giving transit lobbyists an opportunity to promote the findings at a crucial moment in Congress's debate over future transportation funding.
Relying on data from the Texas Transportation Institute, the U.S. Department of Transportation, and the Census Bureau, this paper shows that transit is not a solution to congestion. Transit plays an important role in America, but attempting to use transit to relieve congestion only diminishes its principal role, which is to provide mobility for those who do not have a car available.
How TTI Measures Urban Congestion
The Texas Transportation Institute's congestion calculations rely on data gathered by state transportation agencies and published by the Federal Highway Administration in its annual Highway Statistics reports. Based on these data, TTI uses a computer model that it developed to calculate various measures of congestion for each urban area. These measures include:
* The Travel Time Index, which estimates the time that a trip takes at rush hour relative to the time required in uncongested conditions. An index of 1.50, for example, means that a trip that would normally take an hour takes 90 minutes at rush hour
(90 minutes divided by 60 minutes = 1.50).
* The number of hours of delay per person per year and the grand total for each urban area.
* The gallons of fuel per year wasted due to congestion.
* The cost per year of fuel and time wasted due to congestion.5
* The Roadway Congestion Index (RCI), which measures the volume of traffic compared to highway capacity.6 An urban area roadway operating at capacity has an RCI of 1.00. A roadway averaging 25 percent more than capacity has an RCI of 1.25.
undefined
The principal purpose of the Urban Mobility Report is to assess peak-hour traffic congestion. It focuses on peak periods because most traffic congestion occurs during peak periods.
Further, work trips are particularly important because they are concentrated in peak periods. If work trips, which represent less than one-third of peak-period travel, were evenly spread out through the day, traffic congestion would be considerably less. Congestion during peak periods would be little more than what occurs during the rest of the day.
Transit has the greatest potential to reduce traffic congestion during peak periods, when most congestion occurs. Further, transit ridership is disproportionately work-oriented. Surveys indicate that approximately one-half of all transit trips are to or from work, compared to 23 percent for all modes combined.7
In addition to calculating its traditional congestion measures, TTI's 2003 report also includes several new features:
* The report estimates the effect of "existing" public transit systems on congestion.
* It calculates the effects of operational solutions such as ramp metering, traffic signal coordination, and incident management.
* It calculates the effect of high-occupancy vehicle (HOV) lanes on congestion.
The report also estimates the benefits of extending ramp metering, traffic signal coordination, and incident management to all roads in all 75 urban areas. However, it does not estimate any benefits of expanding transit systems or HOV lanes.8
Problems with TTI's Public Transit Calculations
By including its new calculation of transit's impact, the TTI study got more than the usual publicity as transit subsidy advocates used the findings to support their case for more government subsidies. But a look behind those numbers shows that transit claims are without foundation and are not supported by the report.
TTI's approach to transit is to ask, "What if transit riders were in the general traffic flow?"9 In other words, what would happen to congestion if public transit systems disappeared?
While this might be an interesting academic question, it is irrelevant, as no one has proposed to eliminate public transit systems. Even if they did, private systems would emerge to take their place. The answer to this question does not provide any information that contributes to the policy debates, which are centered more on the appropriate response to current congestion problems, including how to structure public transit systems and whether capital-intensive investments in rail and other fixed-guideway transit are worthwhile.
To calculate the effect of public transit on congestion, TTI assumed that the sole alternative to public transit would be automobiles and that all public transit riders would, in the absence of public transit, drive on all trips that now use transit. This assumption is unrealistic, particularly since two-thirds of transit riders use transit precisely because they are unable to drive because of age, income, or disabilities. In fact, most people ride transit because they have no choice, not because they choose it.
Beyond this, the alternative to public transit is not "no transit," but private transit. Before public transit, every urban area in the TTI study had a privately operated transit system, and if the public system were to disappear tomorrow, the private sector would quickly move in to satisfy the demand.
TTI made another unrealistic assumption regarding transit riders: that the value of their time is zero, or that they are indifferent as to how long it takes them to get from one place to another on transit. In calculating the effect of eliminating public transit, TTI added all the people who now ride transit to the highway system and recalculated the Travel Time Index and other congestion measures for each urban area. This increased the travel time for people who currently drive, but it would decrease the travel time for people currently riding transit because most transit is much slower than auto travel.10 People who switch from transit to cars usually do so in part because automobiles are faster.
Conventional bus service averages around 15 miles per hour. Light rail (trolleys or streetcars) averages around 20 miles per hour. Heavy rail (fully grade-separated subways, elevateds, or metros) averages around 30 miles per hour, while commuter rail (conventional trains operating on tracks shared with freight trains) averages around 35 miles per hour. By comparison, TTI assumed that auto travel in uncongested conditions would average 60 miles per hour on freeways and 35 miles per hour on other roads. Even with congestion, for most transit travelers, switching to automobiles would increase their speeds. This time-savings would offset some of the time lost to other travelers if public transit were eliminated.
Transit "riders understand that [transit] travel might be slower" than auto travel, says TTI. Since they choose to use transit anyway, TTI apparently reasons they must not care about the value of their time. So TTI did not count the time-savings to transit passengers from switching to automobiles; it counted only the time lost to auto drivers if transit passengers were added to the highway flow. Not only is this assumption unrealistic, but it also presumes that the chief reason for getting more people onto transit is to make the commute more convenient for those who remain in their cars. This is demeaning to transit passengers.
By the same token, automobile drivers understand that travel during rush hour will be slower than during other times. Yet TTI does not apply the same logic to automobile users and, unlike its treatment of transit passengers, acknowledges the delay to auto travelers caused by rush-hour congestion.
To make matters worse, TTI counted the delay to former transit passengers who, in the absence of public transit, would drive in congestion and have to spend more time than if they could drive in uncongested traffic. So TTI assumes that time is valuable to transit riders only if they are driving, not if they are riding transit.
For example, a hypothetical transit rider's commute ordinarily takes an hour on light rail but only 30 minutes by automobile in uncongested conditions or 40 minutes in congestion. In counting the cost of eliminating transit, TTI includes the 10 minutes (40 minus 30) spent by the former transit rider in congested traffic but ignores the 20 minutes (60 minus 40) saved by switching to an auto. It appears that close to a fifth of the savings claimed for transit may really be this congestion hypothetically experienced by transit riders. It is simply not reasonable to suggest that a person driving a car for 40 minutes experiences more travel delay that a person who makes the same trip in 60 minutes by transit.
In fact, by shifting people from faster-moving cars to slower-moving transit, overall commute time lengthens because any time-savings that are achieved by lessening congestion are more than offset by lengthening the commute of those who switch from cars to transit. For example, if the transit work trip share in Portland, Oregon, were doubled, the average work trip time for all would rise from 24.4 minutes to 26.7 minutes as some motorists shifted from faster automobiles to slower transit.
Results Skewed by a Few Major Urbanized Areas
Aside from these incredible assumptions, TTI's calculations fundamentally do not make sense. TTI estimates that transit reduces travel delay during peak periods by approximately 30 percent. This is simply not reasonable given that transit represents only 3.8 percent11 of work trips nationwide and less than 1.9 percent of other trips, and that as many as 70 percent of transit passengers do not have access to a car for their trip.
One reason why TTI's numbers are so skewed is that its data and subsequent calculations are heavily weighted by the disproportionately large impact of the New York urbanized area on any measure of national transit trends. Transit clearly plays a critical role in moving people in and to Manhattan. Without transit, Manhattan could not exist. So it is not surprising that New York accounts for 36 percent of the time-savings that TTI attributes to transit. Transit also plays a role, though less important, in the inner cities of Chicago, San Francisco, Boston, Washington, and Philadelphia. These five regions make up another 29 percent of the calculated time-savings. The remaining 35 percent is divided among the other 69 urban areas, where transit is relatively unimportant, even by TTI's dubiously generous calculations.
The 2003 report also asked how much transit would have to expand to keep congestion at current levels. It concluded that transit ridership would have to increase by 20 percent per year in urban areas of 3 million people or more, by 60 percent per year in urban areas of 1 million to 3 million people, and by 80 percent to 100 percent per year in smaller urban areas. The report does not ask what kind of investments would be needed to produce these ridership gains or whether the necessary number of commuters would voluntarily give up their cars for a most likely slower and less convenient trip to work.
Indeed, because of transit's decades-long decline in market share, it is difficult to estimate what it would take to reverse this trend and increase transit's share of urban travel. Furthermore, the continuing loss in transit market share is not unique to the United States. Data for the 1980s and early 1990s show that transit's market share has declined in 24 of 30 urban areas in Western Europe, Canada, Asia, and Australia by an average change of 17 percent over 10 years.12
Other Data Difficulties
In other sections of the TTI report, the data trends presented are not consistent with data provided by the Department of Transportation or other data presented in the report itself. According to the introduction, for example, "From 1982 to 2001 in the 75 urban areas studied, passenger-miles of travel increased over 91 percent on the freeways and major streets and about 100 percent on the transit systems."13 This makes it appear that transit ridership is growing faster than auto travel. However, neither of these numbers is supported later in the report, and both are wrong.
According to data in the report, daily miles of vehicle travel on freeways and other major arterials in the 75 urban areas grew by 77.7 percent from 1982 to 2001. This is well short of the 91 percent claimed earlier. But growth in passenger miles of travel was even less. According to the Department of Transportation, vehicle occupancies during that time declined from 1.76 to 1.63.14 This means that passenger miles of travel grew by only 65.5 percent.
The report exaggerates the increase in transit even more. From 1982 to 2001, total U.S. transit passenger miles grew by just 32.2 percent--one-third of the amount suggested by TTI.15 Since the 75 urban areas in the TTI study account for 95 percent of the 2001 (and historical) transit passenger miles tracked by the Federal Transit Administration, the figure for these areas can be little different from 32 percent.16
Although TTI overestimated both auto and transit growth, the correction reveals a crucial fact: Automobile travel grew twice as fast as transit use. This is important because it helps to dispel the dream that transit can someday replace a significant portion of auto trips.
Transit's Potential to Reduce Traffic Congestion
As noted above, TTI's questionable estimates of the extent to which existing transit system use reduces highway delay during peak hours may be an interesting academic question, but it is irrelevant to public policy since no one seriously proposes canceling all transit service. The less fanciful question that should be asked, and the one that this paper attempts to answer, is the extent to which future expansion of transit might reduce travel delay.
More precisely, this paper seeks to estimate the answers to two questions:
1. What would be the traffic impact of a large increase in transit's peak-hour market share?
2. How much would providing the new transit services cost?
The Transit Market Share Increase Scenario--the principal scenario analyzed--assumes that transit increases its share of urban travel during peak period by 50 percent in five years. (See Chart 1.) It also assumes that during these five years, both the Travel Time Index and the peak-period travel delay per capita for each urban area will continue to change at the same rate as in the past five years (1996-2001). A peak-period work trip transit market share was estimated, using transit's work trip market share and the overall share of travel by transit in each urban area.
It is, in fact, highly unlikely that transit could increase its peak-period market share by 50 percent in five years or even over a much longer period. Experience indicates just the opposite. Transit's share of work trips17 has declined in every decade since the U.S. Census Bureau began collecting the data in 1960. In 2000, transit carried 4.57 percent of work trips, down from 5.12 percent in 1990,18 so a 50 percent increase would mean that transit's market share would rise to 6.85 percent of
work trips.
undefined
Overall Results
Using the methodology and estimation process described in detail in the Appendix, it is apparent that a 50 percent increase in transit's market share--if it could even be accomplished--would have little effect on congestion or travel times. Using TTI's Travel Time Index19 for 2001 as the benchmark--the 75 urban areas registered a 1.249 index that year--projections of transit's peak market share in five years reveal that:
* Without a 50 percent increase in transit's peak-hour market share, the average Travel Time Index would grow to 1.305, an increase of 0.056 over the 2001 Travel Time Index.
* With the 50 percent increase in transit's market share, the average Travel Time Index would be 1.285, an increase of 0.036. The 50 percent increase in transit's peak-period market share would thus result in an improvement of 0.019 in the Travel Time Index.
In 2001, the average delay per capita was 17.9 hours per year in the 75 urban areas. In five years, it is projected that:
* With no increase in transit's peak-hour market share, the average annual delay per capita would be 23.8 hours, an increase of 5.9 hours over 2001.
* With a 50 percent increase in transit's market share, the average annual delay per capita would be 23.4 hours, an increase of 5.5 hours. Compared to the estimated trend increase of 5.9 hours, a transit market share increase of 50 percent would save only 0.4 hours (24 minutes) of delay per capita per year compared to the present trend.
The impact of the two scenarios on the daily lives of people can be estimated by reviewing the impacts on average one-way work trip travel times. The average one-way work trip in the 75 urban areas took an estimated 23.5 minutes in 2001.20 It is projected that in five years:
* With no change in transit's market share, the average work trip travel time would rise to 24.6 minutes, an increase of 1.2 minutes (70 seconds).
* With the 50 percent increase in transit's market share, the average work trip would rise to 24.3 minutes, an increase of 0.8 minutes (48 seconds) from 2001. Overall, the 50 percent increase in transit market share would reduce one-way work trip times by just 0.4 minutes (22 seconds) compared to the present trend.
Overall, these are modest impacts; yet to achieve them would require an almost unprecedented and improbable increase in transit's market share at a staggering cost.
Travel Time Index
As insignificant as these estimated travel time improvements would be, they would not be distributed evenly among the metropolitan areas. In fact, most benefits would accrue to residents of large urbanized areas.
Transit has far more impact in the largest urban areas. It is therefore not surprising that the most significant results occur in what TTI classifies as very large urban areas. The 50 percent increase in transit market share would reduce the Travel Time Index (see Chart 2):
* By 0.058 in very large urban areas (population over 3,000,000).
* By 0.017 in large urban areas (population of 1,000,000 to 3,000,000).
* By 0.011 in medium-sized urban areas (population of 500,000 to 1,000,000).
* By 0.009 in small urban areas (population under 500,000).
undefined
Of the 75 urban areas, New York was projected to have the greatest impact from the 50 percent increase in transit market share. This is to be expected, since transit in the New York urbanized area has more than double the market share of any other urban area and four to five times the national average. In New York, the Travel Time Index would be reduced 0.164.
However, in addition to the overall unlikelihood that transit market share could be increased 50 percent, it could be even more difficult in New York. Much of New York's peak-period transit ridership is in or to Manhattan, where transit's work trip market share is approximately 75 percent--a figure that cannot be increased 50 percent.
Delay per Capita
As Chart 3 reveals, the most significant improvements would occur in the largest urban areas. Except for the very large urbanized areas, the delay reduction stemming from a 50 percent increase in transit's market share would be inconsequential.
undefined
New York was projected to have the greatest reduction (3.8 hours annually) in delay hours per capita from the 50 percent increase in transit market share. However, transit's market share is so high in the core of New York that increasing its market share by 50 percent could be impossible.
Journey to Work
As with the Travel Time Index and annual delay hours per capita, the most significant work trip travel time results occur among the largest urban areas. (See Chart 4.)
undefined
What Would it Cost, and Could it be Done?
For decades, transit spending has increased at a much greater rate than inflation and even faster than ridership, as illustrated by trends over the past 10 years. Between 1990 and 2000, annual spending on public transit by all levels of government increased by an inflation-adjusted 28.8 percent in the United States. Over the same period, transit's work trip market share declined by 10.7 percent. In relation to work trip travel--the most critical element of any transit strategy to reduce traffic congestion--transit productivity fell 30 percent over the past decade.21
Based upon the historical trend that shows market share declines and expenditure increases, it is difficult to imagine any prospective policy scenario--short of some form of coercion--that would increase transit's market share, much less a 50 percent increase.
The few transit share gains that have been achieved have come at great cost. According to Census data, 11 large metropolitan areas were able to increase their transit work trip market shares from 1990 to 2000.22 Over that same period, transit expenditures increased by an inflation-adjusted $3.5 billion in those 11 areas. Assuming that non-work travel on transit increased by the same percentage,23 the cost per new peak-hour traveler was $14,357 annually, or nearly $1,200 per month. This is more than the monthly lease for most cars, including luxury cars such as the Lexus 430 or the Lincoln Town Car.
If the success of these metropolitan areas could be replicated across the nation, the annual additional cost to increase transit's peak-period market share 50 percent would be $85 billion per year, the equivalent of a more than $0.40 increase in the federal gasoline tax.
Low-Cost Ways to Relieve Congestion
What Does Work?
Fortunately, there are a number of low-cost ways to relieve congestion, some of which were identified by the Texas Transportation Institute in its 2003 Annual Urban Mobility Report. These include freeway ramp metering, traffic signal coordination, and incident management.
Freeway ramp metering, which puts traffic signals at on-ramps, seems annoying, but it can save motorists' time by smoothing out freeway flows. According to the mobility report, metering currently saves motorists 73 million hours a year. However, many freeways do not yet have ramp metering. TTI estimates that adding it to congested freeways that do not now have it could increase time-savings by nearly 200 million more hours.
Where ramp metering saves time on freeways, traffic signal coordination aims to save people time on arterial roads. Coordinated signals allow motorists to drive at a steady rate of speed without stopping at each signal. TTI calls this "one of the most cost-effective tools to increase mobility" on signaled roads. Yet only about 59 percent of signalized intersections in the areas studied in the mobility report are coordinated. TTI estimates that coordinating the rest could save motorists an added 17.2 million hours a year.
The mobility report estimates that half of all congestion is due to accidents, stalled cars, and similar incidents. Incident management uses video cameras and other means to detect such obstructions, combined with patrols ready to move these obstructions quickly out of traffic. About half of all urban areas had incident management programs in 2001, and the mobility report says these programs saved motorists more than 100 million hours. Implementing it in the remaining urban areas could save motorists another 100 million hours a year.
One technique that did not seem to work as well is high-occupancy vehicle lanes. Initially, planners hoped that such lanes would encourage people to carpool more, but carpooling has declined steadily in tandem with shrinking family sizes. Except in rare instances, such as the San Francisco-Oakland Bay Bridge, carpool lanes have not promoted carpooling or ridesharing.
Nevertheless, carpool lanes can be most effective tools if they end up moving more people, due to higher occupancies, than general-purpose lanes. A lane with two-thirds as many cars as adjacent lanes does more work if those cars have twice as many people as the other lanes. Regrettably, many of the carpool lanes in America's urbanized areas do not carry enough traffic to be worthwhile.
A better way to use HOV lanes is to turn them into high-occupancy/toll (HOT) lanes, as recommended by Robert Poole and Ken Orski in a report published in February 2003.24 High-occupancy vehicles would still use these lanes for free, but low-occupancy vehicles could also use them by paying an electronic toll. This would get more use out of the lanes and give drivers a choice between taking the congested lanes for free or paying a little more and getting home quicker.
HOT lanes will help solve another problem that simply increasing gasoline taxes or using sales or other taxes to pay for transportation improvements would not address. It costs much more to provide roads capable of handling peak demand than it does to provide roads sufficient to meet average demand. Yet gas taxes are the same whether people drive during rush hour or at midnight.
HOT lanes can resolve this problem if they use value pricing, meaning that they charge more during congested periods than during other times of the day. This will help encourage people to take advantage of flextime or otherwise drive during less congested times of the day. Since well over half of all traffic on the road during rush hour is not work-related, value pricing can help to relieve congestion by encouraging non-work-related travel to shift to other times of the day.
The revenues from HOT lanes should be dedicated exclusively to expanding a region's HOT-lane network. One way to accomplish this is to create regional toll road authorities. Such authorities could sell bonds, buy land, take over unused state or local rights of way, and build new lanes and roads to relieve congestion.
If these ideas can relieve congestion, why are they not used everywhere? One answer is that the leaders of many urban areas have decided not to solve the congestion problem. Instead, they seek to increase congestion out of a perverse hope that increased congestion will somehow reduce congestion by convincing some people to use transit instead of driving.
What Does Not Work
Many urbanized areas have reduced traffic signal coordination; changed one-way streets to two-way (effectively eliminating signal coordination); placed barriers in roads (euphemistically called traffic calming but more accurately titled congestion building ); and spent transportation funds that could be used to reduce congestion on unrelated activities. Supporters of these steps include a congestion coalition of planners, urban environmentalists, transit agencies, and transit builders who hope to gain when people agree to build rail transit out of desperation.
Portland, Oregon, is a leader in this movement. Local officials have put speed bumps in collector streets and eliminated lanes from minor arterials. The regional transportation plan for the Portland area calls for turning many arterials into boulevards --the planners' term for fewer lanes and wider sidewalks--with the aim of increasing walking and bicycling at the expense of driving. The region's transportation planning models predict that these actions will increase walking and cycling from 5 percent of the region's trips all the way to 6 percent.
Portland is also obsessed with rail transit at the expense of auto driving. A major bottleneck in the region is located on Interstate 5, which runs north and south from Washington, through Oregon and into California. A crucial segment of the highway runs through the city of Portland but has only two lanes each way and is heavily congested. For 50 miles to the north and south of this segment, Interstate 5 is at least a six-lane highway, much of it in rural areas.
Highway planners estimate that adding a new lane to this section would cost around $10 million, but the region has instead spent well over $10 million on planning just this section of road. In April 1998, Chairman Henry Hewitt of the Oregon Transportation Commission testified before an interim legislative committee that Portland planners had asked the state not to relieve this bottleneck until a light-rail line is built between Vancouver and Portland. Vancouver has refused to pay the hundreds of millions of dollars required for its share of this light-rail line, and Portland planners are literally holding the cure for this bottleneck hostage until Vancouver funds light rail.
In other words, relieving congestion is less of a technical problem than it is a political problem. Unless the people who are most affected by congestion work together to challenge the congestion coalition, urban congestion will continue to worsen no matter how much money people vote to spend on transportation improvements, because that money will likely be spent on things that will not reduce congestion.
In the long run, it is likely that congestion will be solved, or at least greatly reduced, through the use of intelligent highways on major busy roads. Such highways would include sensors that detect and control cars, with computers that automatically steer, accelerate, and slow cars in tandem. This would allow much higher traffic flows per lane than are currently seen, perhaps quadrupling the capacities of a given highway space.
Many automobiles today have cruise control, and some newer models sense when a car ahead slows down and automatically slow in response. The Toyota 2004 Prius will self-steer. All that will be needed is to connect self-accelerating, self-braking, self-steering cars to an intelligent highway network.
Hybrid-electric cars such as the Prius also virtually eliminate air emissions and greatly reduce energy consumption. Thus, most of the reasons cited for heavy investments in rail transit--saving energy, reducing air pollution, and solving congestion--are being taken care of at a much lower cost without attempting to force people who can drive to use less efficient mass transit.
Conclusion
The evidence cited in this study shows that an increase of at least 200 percent in transit spending would be needed to increase transit's market share of peak-hour commuters by 50 percent. Yet this would save urban commuters no more than an average of 22 seconds each way to work (44 seconds per day). Moreover, in most urban areas, total driving and per capita driving continue to grow so fast that within a few months, at most, all of that savings would be consumed by new traffic.
In recent decades, much federal, state, and regional transportation policy has been based on the assumption that transit can help relieve highway congestion, which has led many urban areas to write plans that spend well over half of their transportation budgets on transit systems that carry well under 5 percent of passenger travel, not to mention virtually no freight.
For example, Atlanta's metropolitan planning organization adopted a 25-year plan committing 56 percent of future funding to transit, which carries approximately 1.5 percent of travel demand. This funding/demand discrepancy is repeated in all other metropolitan regions that propose to build rail transit. One report indicates that the nation's 19 largest urban areas plan to spend half of their transportation funds on transit, while the average transit market share in those areas is less than 3 percent.25
There is no indication that this additional money for transit will produce a material shift from cars to transit. Virtually all of the nation's metropolitan planning organizations project that almost all new travel growth will be by automobile rather than transit.
Some transportation planners actually applaud rail transit's inability to reduce congestion. Their goal is to increase congestion. They believe that the residents of their urbanized areas are better served by wasting time in cars that burn fuel and pollute the air in stop-and-go traffic out of a forlorn hope that a few of those drivers will give up in frustration and ride transit. Yet their own transportation planning models show that very few drivers will stop driving because of congestion, principally because automobile-competitive transit service is provided to few destinations other than downtown.
Urban leaders who seriously want to reduce congestion should demand that transportation planners calculate the dollar cost per hour of delay that is reduced by proposed highway, transit, and other transportation improvements. This consistent test can easily be calculated for almost any transportation capital improvement using urban transport models. There may be other measures by which proposed projects should be judged, but as far as congestion goes, this is the primary if not the only valid measure.
Applying such a measure to highway, transit, and other projects will reveal that many projects are not economically justified, at least on congestion-reduction grounds. Yet many projects can easily save hours of delay at a fairly low cost. These include freeway ramp metering, incident management, and traffic signal coordination. Many low-cost highway expansions and bus improvements will also produce high returns. Rail transit will rarely make the grade.
High-occupancy/toll lanes are a special case. They should require no subsidies, so the only question is whether a particular road can pay for itself. The best way to answer this question is to create an independent toll roads authority that has the power to build roads, charge for them, and fund itself exclusively out of its receipts.
Public transit is important for people who cannot drive, but it is not a solution to congestion. Efforts to build expensive rail transit lines in the hope of reducing congestion are doomed to failure and often detract from transit agencies' ability to carry out their primary mission of providing mobility for people who have no access to cars.
Wendell Cox, Principal of the Wendell Cox Consultancy in metropolitan St. Louis, is a Visiting Fellow at The Heritage Foundation and a visiting professor at the Conservatoire National des Arts et Metiers in Paris. Randal O'Toole is Senior Economist at the Thoreau Institute.
Appendix: Notes on Methodology
The following method was used to project the impacts of a 50 percent increase in transit peak-period market share in urban areas over a five-year period, with peak periods defined as 6:00 a.m. to 9:00 a.m. and 4:00 p.m. to 7:00 p.m.
"Trend Scenario" Assumptions
* Public transit's peak-period market share would be the same in five years as it was in 2001.
* The Travel Time Index would increase over the next five years at the same rate as between 1996 and 2001 in each urbanized area.
* Annual delay hours per capita would increase over the next five years at the same rate as between 1996 and 2001 in each urbanized area.
* An average journey-to-work time estimate (in minutes) was developed by adjusting the 2000 Census figure for each urbanized area by the change in the Travel Time Index from 2000 to 2001 and by the projected change for five years.
"Transit Market Share Increase
Scenario" Assumptions
* Transit market share would increase by 50 percent over trend.
* Transit's peak-period market share was estimated, assuming that transit and auto users would have the same propensity to carpool. According to the National Household Travel Survey, 29 percent of peak-period travel is to or from work.26 Each urbanized area's journey-to-work market share from the 2000 U.S. Census was used for this portion of transit travel. The other 71 percent of peak-hour travel was assumed to have a transit market share equal to the overall transit market share for each urbanized area (adjusted to 1.25 average automobile occupancy). These weighted figures were combined to establish an estimated peak-period market share for transit. The estimated peak-period transit market share was increased by 50 percent.
* The Travel Time Index and the average annual delay per capita from the "Trend" scenario were reduced by a percentage equal to the transit peak-period market share.
* Average journey-to-work time was estimated by adjusting the "Trend" scenario figure by the difference in the Travel Time Index between the "Trend" scenario and the "Transit
Why Speed Bumps dont make Children Safer
Speed Humps Study Contains Numerous Flaws
by Randal O'Toole and Kathleen Calongne
12 August 2006
A recent paper purporting to show that speed humps make residential streets safer for children actually shows nothing of the kind. In fact, the study's data can even be interpreted to mean that humps make streets more dangerous.
Speed humps are annoying and potentially dangerous to drivers and can cause deadly delays to emergency service vehicles. But an Oakland, California study claims to show that speed humps make streets 50 to 60 percent safer for children.
The study used a database showing when and where 1,600 speed humps were installed on Oakland streets between 1995 and 2000. Ideally, the researchers would have compared accident rates on those streets before the speed humps were installed with rates after -- but they did not. Or they could have compared accident rates on those streets with rates on streets that did not have speed humps -- but they did not, at least not directly.
Instead, the study used emergency room data to identify 100 accidents in which a child under 15 years was hit by a car in those years. Forty-nine of those accidents were on the same street and block on which the child resided and of those, six had speed humps.
As a "control," for each accident the study examined two "randomly selected" non-automobile related emergency room visits that took place on the same day as the auto accident involving a child living on a residential street of the same age and gender as the one in the auto accident. The only point of this complicated and error-prone procedure was to estimate what share of children lived on streets with speed humps, the supposed answer being about 24 percent.
If 24 percent of Oakland children live on streets with speed humps but only 14 percent of child-auto accidents took place on streets with speed humps, the authors conclude that this proves that streets with speed humps are safer.
In addition to the above 49 accidents, the authors found another 51 accidents in which children who were hit by cars lived on streets with speed humps. But these accidents did not take place on the streets the children lived on -- the streets with the speed humps -- but on other streets up to a quarter mile of the children's homes.
Curiously, the researchers found that having a speed hump in front of your home reduces your child's chances of being hit by a car a quarter mile away from your home by the same percentage as they reduce the chances of being hit in front of your home. The study does not say how a speed hump in front of your home protects your children when they are a quarter mile away. This strange finding should have signaled to the authors that something was wrong with their methods.
In fact, there are numerous problems with their methodology. First, about 85,000 children under the age of 15 live in Oakland, yet the authors base this study on just 49 accidents (100 counting the accidents on streets other than the streets on which the children live). The size of that sample is far too small to be reliable.
Second, the study uses a "control" group to find out the share of children that live on streets with speed humps. The study claims that the control group was "randomly selected," yet first the authors had to identify each child's age, sex, and residential location (because only children who lived on residential streets were considered). With such a small sample, their selection could easily have biased the result.
There are far more reliable methods of estimating what share of children live on streets with speed humps. One way would be to simply count the residential streets in Oakland and determine what share of those streets had humps, adjusting for the population density in each neighborhood. Another way of doing the study is to measure accidents on streets before and after installation of speed humps. A Portland study that used this method found that speed humps reduced accidents by only 5 percent, which the researchers said was too small to be statistically significant.
The problems with small samples can be seen in the statistical data reported in the Oakland paper. The paper says that children living on streets with speed humps are 40 percent as likely to be hit by cars on their street as children on streets without speed humps. But a table in the paper says that the "confidence interval" for this number ranges from 15 percent to 106 percent.
In statistical terms, this means the authors are 95-percent certain that streets with speed humps could be anywhere from 85 percent safer to 6 percent more dangerous than streets without speed humps. This broad confidence interval means there is no certainty at all, demonstrating that the sample size was too small.
To top it off, the paper relied on data showing when speed humps were installed on Oakland streets after 1995. Yet, in correspondence, the authors admit that an unknown number of Oakland streets -- at least 125 -- had speed humps installed before 1995. Since these were not in their database, any accidents on those streets would have been counted as accidents on streets without speed humps. This error could easily account for the differences, statistically insignificant though they may be, estimated by the paper. Nor, in fact, did the authors verify that there actually were speed humps on all the streets in their database.
Naturally, the authors made no attempt to look at the other side of the question, which is whether any problems were caused by speed humps delaying emergency service vehicles. How many houses burned more than they might have because of delays to fire crews? How many people, including children, may have died because of delays to paramedics? How many burglars got away because of delays to police?
In a city with 85,000 children, the authors could find only a few dozen pedestrian accidents over a six-year period involving children on their street of residence. Considering that other studies have shown that problems caused by delays to emergency service vehicles completely dwarf the benefits of speed humps, advocates of speed humps and other traffic delaying devices will need better research using more data addressing the full range of the impacts of these devices before anyone can conclude that speed humps are a good idea.
This article was co-authored by Randal O'Toole of the Thoreau Institute and Kathleen Calongne of the Independence Institute Center for the American Dream. Please feel free to forward or reprint the article with appropriate citation.
San Jose Light Rail Fails to Deliver on Ridership; does not help congestion
12/6/02
Like San Diego, Portland, and St. Louis, San Jose jumped on the light-rail bandwagon in the early 1980s. It opened its first light-rail line in 1988 and has steadily, if slowly, expanded the system ever since. Secretary of Transportation Norman Mineta, who was San Jose's representative in Congress when the first light-rail lines were funded, is a big fan of light rail and promotes it in many other cities.
Yet no reasonable person could look at San Jose's light-rail lines as an example of sound transportation planning. Not only does San Jose light rail contribute almost nothing to the region's transportation needs, its ridership is pathetic even by the standard of other U.S. light-rail lines.
San Jose light-rail construction costs have not been excessive relative to other light-rail lines. But its low ridership means high operating costs per rider. These high costs are a major factor in a financial crisis that is facing San Jose's transit agency, the Santa Clara Valley Transportation Authority (VTA).
History
The Santa Clara County Transit District (now known as the Valley Transportation Authority or VTA) took over San Jose's privately owned bus lines in 1976. Armed with a permanent one-half cent sales tax, the agency rapidly expanded the region's bus service and doubled bus ridership in just three years.
From the start, the agency was also enamored with light rail and began planning an extensive rail network. The 1983 environmental impact statement for the first light-rail line also considered busways, HOV lanes, and highway expansions as alternatives to light rail.
The study showed that highways were by far the most efficient way to handle increased transportation demand. While the cost of light rail per new rider (that is, the cost of attracting someone out of their car) was estimated to be around $2 per ride, the cost of new roads diverting a car off of existing roads was estimated to be less than 10 cents per vehicle mile. Yet the road improvement alternatives were discarded.
The study estimated that the line would carry 40,000 riders a day soon after it opened. But it also estimated that a busway would cost less to build and attract even more riders than light rail. Still, it claimed that light rail would cost less to operate than buses. "Since the (operating) subsidies needed to supplement fares are paid out of local tax resources," said the plan, this difference in operating costs tilted the decision toward rail.
For the cost of constructing its first light-rail line, the transit agency could have doubled the number of buses in its system. But then it would have to operate those buses, which it couldn't afford to do. Since federal and state funds were available only for capital costs, not operating costs, it elected to spend the maximum capital funds on projects that would pose the least operating cost. Of course, the reason why operating costs were low was that the project served only a tiny fraction of the region.
In short, light-rail technology was selected for reasons other than efficiency or common sense. The effect on the transit agency's budget probably played the biggest role in the decision to choose light rail over roads or expanded bus service.
Environmental impact reports for later light-rail lines did not seriously consider busway or highway improvements. They did, however, project significantly higher costs per new rides. Where the first line was estimated to cost around $2 per new ride, the second line, known as the Tasman Corridor, was projected to cost more than $40 per new ride. Capital costs of $42 million per mile, compared to less than $30 million per mile for the initial line, played only a small part of this cost hike. The main reasons for the increase appear to be more realistic estimates of operating costs and ridership.
Phase one of the region's first light-rail line opened in 1988 and by 1992 it was 21 miles long. The 7.6-mile Tasman line opened in 1999 and a 1.9-mile extension opened in 2001. With funding from another one-half cent sales tax approved in 1996, two more lines are expected to open in 2004.
Ridership Falls Far Short of Projections
The emphasis on light rail led the agency to forego further expansions to the bus system. As a result, transit ridership in 1987 was actually lower than in 1982.
Ridership grew over the next four years as phases 1 through 4 of the first light-rail line were opened in succession. By 1992, when the line was completed, ridership was 35 percent greater than before it opened. Since riders are counted twice when they board a bus and then transfer to rail, at least some of this increase was due to more transfers as the agency replaced downtown buses with buses to light-rail stations. But at least some of the increase was real.
Success was short lived, however, as ridership immediately began to decline after 1992. Ridership fell so much in 1993 that the agency was forced to cut bus and rail service due to revenue shortfalls. While the number of rides began to rise again in 1996, passenger miles of travel have remained below 1992 levels in every year through 2000 except 1998. Moreover, far from reaching 40,000 riders per day, the highest ridership achieved was 22,700 per weekday in 1998. Ridership fell slightly in 1999.
In 2000, Santa Clara County voters were persuaded to fund more light-rail lines as well as an extension of BART to San Jose. Proponents naturally claimed that rail transit would reduce regional congestion. In fact, transit in general, and light rail in particular, has an insignificant effect on congestion.
When compared with other light-rail lines in the U.S., San Jose's light-rail vehicles appear to be running almost empty. On average, San Jose buses carry 9.2 people at any given time, which is about 86 percent of the national average. But San Jose light-rail vehicles carry only 14.8 people at any given time, which is less than 57 percent of the national average.
Table One
Passenger Miles Per Vehicle Mile
Bus LRT
San Jose 9.2 14.8
National 10.7 26.1
Source: 2000 National Transit Database National Profile and San Jose profile.
Another standard of comparison is the number of passenger miles carried per route mile of track. On average, U.S. light-rail lines carried 4,400 passenger miles per route mile per day in 2000.
By this measure, the most productive light-rail system is in Boston, which carried 8,500 passenger miles per mile. The least productive is -- you guessed it -- San Jose's, which at 1,750 passenger miles per mile carried less than half the average and only about a fifth of Boston's level.
Table Two
Daily Passenger Miles Per Route Mile
Boston 8,484
St. Louis 7,681
Los Angeles 6,977
Portland 5,937
San Diego 5,318
Salt Lake City 4,536
San Francisco 4,258
Dallas 4,023
Newark 3,445
Buffalo 3,411
Sacramento 3,065
Baltimore 2,795
Denver 2,762
Pittsburgh 2,600
Philadelphia 2,443
Cleveland 2,196
San Jose 1,749
Source: National Transit Database 2000.
San Jose light rail does not compare well with other forms of transportation either. The only rail transit that is less productive than San Jose's LRT are the poorly located tourist trolleys in Seattle, Memphis, and Kenosha. San Francisco cable cars and New Orleans tourist streetcars are both more productive than San Jose light rail. (The Hudson-Bergen light rail, which is also poorly patronized, opened in mid-2000 so adequate data are not yet available for comparison.)
Table Three
Daily Passenger Miles Per Route or Lane Mile
San Jose freeways 29,950
BART heavy rail 17,074
San Jose expressways 4,300
CalTrain commuter rail 3,372
San Francisco cable cars 3,283
New Orleans streetcars 2,265
San Jose light rail 1,749
Source: National Transit Database 2000, Highway Statistics 2000 table HM-72, Texas Transportation Institute (for expressway, aka "principle arterial," data).
San Jose's original light-rail line cost about $25 million per mile in 1992 dollars (about $30 million in today's dollars). More recent lines cost or are projected to cost about $40 million a mile. These costs are for tracks in both directions, so must be cut in half to get the cost per route mile.
For comparison, a lane mile of expressway costs about $2 to $3 million; a lane mile of freeway costs about $5 to $10 million. Thus a route mile of San Jose light rail costs about one-and-a-half to four times as much as a freeway lane mile and five to ten times as much as an expressway lane mile. Since light rail carries far fewer passengers than freeways and expressways, it costs 12 to 70 times as much per passenger mile as expressways and freeways.
Light rail's poor performance is reflected in transit's tiny market share of San Jose-area motorized transport. The Valley Transportation Authority claims that transit has a 2.7 percent share of the market for personal transportation, but it measures market share in terms of trips. Because transit is slower, auto trips average nearly three times the distance as transit trips, so in terms of passenger miles transit has a much smaller share.
In 2000, transit carried just 1.0 percent of motorized passenger miles of travel in the San Jose area. Light rail carried about 17 percent of transit passenger miles, so it carried 0.17 percent of total motorized passenger miles.
High Operating Costs
Light rail's low ridership is also reflected in high operating costs. According to the Federal Transit Administration (FTA), most light-rail transit agencies spend less on operations and maintenance on light rail than on buses, whether measured per trip or per passenger mile. (The FTA formula leaves out significant maintenance costs, but we'll ignore that for now.)
As shown in the table below, however, operating San Jose light rail costs more per trip and per passenger mile than San Jose buses. The table also shows that both bus and rail operating costs are significantly higher than the national averages. This is simply a reflection of low overall transit ridership in San Jose.
Table Four
Cost Per Trip and Passenger Mile
Cost/Trip Cost/PM
Bus LRT Bus LRT
San Jose 3.85 4.82 1.02 1.07
National 2.19 1.89 0.59 0.45
Source: See table one.
No Effect on Increasing Congestion
The Texas Transportation Institute, which has tracked urban congestion since 1982, says the amount of time the average San Jose commuter wastes sitting in traffic has more than tripled in the last two decades. The Institute estimates this congestion costs commuters a billion dollars a year, or more than $1,400 per commuter, and burns up nearly 90 million gallons of fuel per year.
There is a good reason for the increase in congestion. Since 1982, the number of miles driven in the San Jose urban area has increased by more than 68 percent, but the number of road miles has increased by only 15 percent. The miles of freeway driving have increased by 50 percent, but freeway lane miles have increased by only 18 percent.
Light rail, which carries less than 0.2 percent of passenger miles of travel and virtually no freight, obviously does nothing to reduce this congestion. Yet the Valley Transportation Authority wants to devote 80 percent of the region's capital transportation funding to mass transit, most of which will go to build new light-rail lines and an extension of BART heavy rail to San Jose. Despite the obvious conflict of interest, the Valley Transportation Authority not only runs transit but does all transportation planning for Santa Clara County, so this is the direction San Jose is heading.
Despite the agency's pretense at comprehensive transportation planning, it does not seriously consider road alternatives. The environmental impact report for a light-rail line currently under construction didn't bother to consider road expansion as an alternative because, it said, it "would not meet the goal of providing a viable alternative to the automobile." The fact that light rail has proven to be a non-viable alternative to the automobile didn't dissuade the agency from building the new line.
The plan to spend 80 percent of capital funds on transit is supported by the Metropolitan Transportation Council, which is the metropolitan planning organization for the San Francisco-Oakland-San Jose metropolitan areas. The council admits that spending 80 percent of its funds on transit will not boost transit's market share, which is about 4 percent in the region as a whole.
The Valley Transportation Authority claims that its plans, if fully funded, will increase transit's share of Santa Clara County trips from 2.7 percent to 4.3 percent by 2020. Since auto trips are longer, this would be an increase from 1.0 to 1.6 percent of passenger miles of motorized travel.
Automobile travel in the San Jose urbanized area has been growing at about 1.75 percent per year, and Valley Transportation conservatively predicts it will continue to grow by 1.2 percent per year over the next twenty years. This means that the congestion relief provided by increasing transit's share from 1.0 to 1.6 percent over twenty years would be exhausted by just four to six months growth in auto traffic.
Transit Funding Crisis
The transit agency's assumption of full funding is currently in jeopardy. The agency's long dependence on sales taxes leaves it highly vulnerable to recessions. The current recession has also caused a severe drop in ridership, particularly in light rail. Bus ridership in 2002 to date is 7 percent lower than in 2001 and light-rail ridership has fallen by 29 percent.
As a result, the agency fears it will run out of cash by mid-2003. Even though voters approved a new sales tax in 2000, the agency estimates it will fall $6 billion short of its funding needs over the next twenty years.
By an amazing coincidence, $6 billion is approximately the amount Valley Transportation wants to spend building BART and new light-rail lines. But rather than halt construction, the agency is cutting back on bus service.
Service cuts are expected by April 1 at the latest even as the agency continues to build two new light-rail lines. If history is a guide, opening service on these two new lines will simply put the agency's operating budget further into the red.
A December 6, 2002, memo from the agency's general manager to its board reveals that the agency is considering three alternatives, one of which would reduce bus service by 70 percent, eliminate weekend light-rail service, and cut weekday light-rail service by 10 percent.
None of the alternatives considered would halt or even slow construction of any light-rail lines. Moreover, it is clear that cuts in bus lines, which serve many low-income and minority neighborhoods, will be more severe than in light-rail service, which mainly serves white middle-class riders. This is particularly ironic considering that the percentage decline in light-rail ridership is four times greater than in bus ridership.
On top of that, Valley Transportation has proposed to sell several pieces of land that it had purchased for park-and-ride stations. It already sold one five-acre parcel to the City of San Jose for $8.5 million, which a San Jose city councilor says was necessary "to meet payroll." The city plans to build subsidized housing on these parcels.
Conclusions
Light rail is an obsolete technology that doesn't really work anywhere. But it is especially unsuitable in post-automobile urban areas such as San Jose, whose jobs are spread throughout the area rather than concentrated in a downtown.
San Jose made a major mistake in committing itself to such an inappropriate form of transit. It is compounding that mistake by continuing to build light rail even as congestion increases and funds run short to operate its transit services
Monday, July 9, 2007
Debunking Portland Light Rail
No. 596 July 9, 2007
Debunking Portland
The City That Doesn’t Work
by Randal O’Toole
Executive Summary
Oregon, a model of 21st-century urban planning,
the region’s integrated land-use and transporta-
tion plans have greatly reduced the area’s livabili-
ty. To halt urban sprawl and reduce people’s
dependence on the automobile, Portland’s plans
use an urban-growth boundary to greatly increase
the area’s population density, spend most of the
region’s transportation funds on various rail tran-
sit projects, and promote construction of scores of
high-density, mixed-use developments.
When judged by the results rather than the
intentions, the costs of Portland’s planning far
outweigh the benefits. Planners made housing
unaffordable to force more people to live in multi-
family housing or in homes on tiny lots. They
allowed congestion to increase to near-gridlock lev-
els to force more people to ride the region’s expen-
sive rail transit lines. They diverted billions of dol-
lars of taxes from schools, fire, public health, and
other essential services to subsidize the construc-
tion of transit and high-density housing projects.
Those high costs have not produced the utopia
planners promised. Far from curbing sprawl, high
housing prices led tens of thousands of families to
outside the region’s authority. Far from reducing
driving, rail transit has actually reduced the share of travel using transit from what it was in 1980. And developers have found that so-called transit-
oriented developments only work when they include plenty of parking.
Portland-area residents have expressed their
opposition to these plans by voting against light
rail and density and voting for a property-rights
measure that allows landowners to claim either
compensation or waivers for land-use rules
passed since they purchased their property.
Opposition turned to anger when a 2004 scandal
revealed that an insider network known as the
“light-rail mafia” had manipulated the planning
process to direct rail construction contracts and
urban-renewal subsidies to themselves.
These problems are all the predictable result
of a process that gives a few people enormous
power over an entire urban area. Portland should
dismantle its planning programs, and other
cities that want to maintain their livability would
do well to study Portland as an example of how
not to plan.
Introduction
The city of Portland, Oregon, has received
enormous publicity in recent years for its land-
use and transportation planning. The New
York Times calls Portland “the city that loves
mass transit.”1 Portland is “successfully getting
people out of their cars,” says the BBC.2
From all over the country, city planners,
elected officials, and reporters travel to Portland
to examine the region’s urban-growth bound-
ary, rail transit system, and transit-oriented
developments. “It sometimes seems as if the
whole country is looking to Portland as a role
model for 21st-century urban development,”
says Governing magazine.3 Portland’s plans have
won numerous awards from the American
Planning Association, and Congress happily
gives the city more than its share of federal tran-
sit dollars to fund expansion of the region’s
light-rail system.
Residents of the Portland area are not as enthusiastic about the region’s planning process. Recent elections reveal that most cit-
izens are upset by the unaffordable housing, traffic congestion, increasing taxes, declining urban services, and disappearing jobs that have resulted from the plans.
In 1995, the city council adopted the slo-
gan, “The City That Works.”4 No one on the
council felt any sense of irony that Portland
was borrowing a slogan first applied to
Chicago by Mayor Richard J. Daley. Daley, of
course, was famous for using a political
machine of patronage and pork to get himself
reelected five times. Since few Portland may-
ors remain in office for more than two terms,
no one imagined in 1995 that the Northwest
city was also run by a machine.
The head of that machine, Neil
Goldschmidt, had been mayor of Portland in
the 1970s. President Carter appointed him
Secretary of Transportation in 1979, and in
the late 1980s Goldschmidt served as gover-
nor of Oregon. In 1991 he left public office
and started a political consulting firm that
used his federal, state, and local contacts to
promote seemingly idealistic schemes that
quietly diverted billions of dollars in public
funds to Goldschmidt’s clients and cronies.
Known to insiders as the “light-rail mafia,”
Goldschmidt’s machine suffered a huge set-
back in 2004 when the public learned that,
while mayor, Goldschmidt had a three-year
sexual relationship with a teenage girl starting
when she was just 14. The former mayor disap-
peared from view, leaving his allies to fend for
themselves. Today, public employee unions,
neighborhood groups, and county officials are
among those challenging what remains of the
machine, and the main goal of many of these
groups is to halt the diversion of funds from
essential urban services to expensive transit and land-use projects.
History
The planning that made Portland famous
attempts to integrate land-use and transporta-
tion. Urban planners have long believed in a
land-use-transportation connection that would
allow them to manipulate one through the
other. So Portland plans land uses to try to
reduce the amount of driving people do while it plans transportation to try to slow the con-
version of rural land to urban purposes.
No such integration was contemplated in
1973, when the Oregon legislature required
every city and county to write plans that con-
formed to goals and guidelines established by
a Land Conservation and Development
Commission appointed by the governor. The
rules aimed to protect farmland from leapfrog
development (subdivisions not physically
adjacent to the nearest urban area) by requir-
ing all cities in the state to draw urban-growth
boundaries. Development inside the bound-
aries was allowed to proceed unchecked while
development outside was strictly limited to rural uses.
The commission’s rules specified that the
initial urban-growth boundaries should
include enough land to accommodate twenty
years worth of growth. As that land was devel-
oped, cities were to expand the boundaries to
maintain land and housing affordability.
2
Indeed, due in part to a severe recession, hous-
ing in Portland and other Oregon cities remained very affordable through 1989.5 The goal was to keep development orderly and effi-
cient, not to slow or stop development.
Transportation planning was a completely
separate process, responding mainly to federal
funding and mandates. Inspired by federal
support for 90 percent of the cost of urban
interstate freeways, Portland had planned a
gridded network of such highways. But the
early 1970s saw a backlash against urban inter-
states from neighborhood residents who
argued that freeways reduced their property
values. In response, Congress passed a law
allowing cities to cancel planned interstate
highway projects and to spend the money on
mass transit capital improvements instead.6
Under Mayor Neil Goldschmidt, Portland
became one of the first cities to take advantage
of the law, canceling a road known as the Mt.
Hood Freeway in 1974. But that created a
dilemma for the city. The federal share of the
freeway cost would be enough to buy hundreds
of new buses. But Portland’s transit agency did
not have the funds to operate that many new
buses. Moreover, simply buying buses did not
create the local construction jobs and profits
that would have been gained from freeway con-
struction.
Goldschmidt’s solution was light-rail tran-
sit, a sort of heavy-duty streetcar that some-
times operated in streets and sometimes on an
exclusive right of way. The term light rail had
been coined in 1972; light referred not to weight
of the vehicles or the rails but to the smaller
numbers of people carried by these rail vehicles
relative to the large numbers carried by the
New York City subway or other heavy-rail lines
such as Washington’s Metro.
For Goldschmidt, the big advantage of
light rail was that it was expensive, easily cost-
ing enough to absorb most of the federal
funds that had been allocated to the Mt.
Hood Freeway and (as it turned out) much
more. Rail construction also provided lots of
jobs and profits for local contractors.
At the time, few observers noted the irony
that an urban transit technology was selected
3
precisely because of its high cost. President
Carter was so impressed with Goldschmidt’s
innovative solution to the freeway controversy
that he made Goldschmidt his second secre-
tary of transportation. As it turned out, light
rail required so much planning and design
work that construction did not begin until
Goldschmidt had left that office in 1981 and
was not completed until Goldschmidt was
running for governor of Oregon in 1986.
Until that point, there was still no con-
nection between Portland’s land-use and
transportation planning. But when the light-
rail line opened, the city zoned much of the
land near light-rail stations for high-density
housing in order to allow more people to live
within walking distance of the light rail.
During Goldschmidt’s term as governor,
the Land Conservation and Development
Commission began writing a transportation-
planning rule.7 This rule was heavily influ-
enced by controversy over another proposed
freeway, this one skirting the southwestern
suburbs of Portland. A land-use group called
1000 Friends of Oregon argued that the high-
way would lead to expansion of the urban-
growth boundary and that the city could avoid
such expansion by integrating its land-use and
transportation planning to emphasize com-
pact development that relied on transit, walk-
ing, and cycling instead of driving.8
The proposed highway was never built and
the final transportation-planning rule
endorsed the 1000 Friends’ ideas. The rule
directed planners in all of Oregon’s major
urban areas to change “land-use patterns and
transportation systems” so as to reduce per-
capita driving by 10 percent in 20 years and 20
percent in 30 years.9 To reach those goals, the
rule specified that planners must increase resi-
dential densities, promote mixed-use develop-
ments, mandate pedestrian-friendly design
(meaning, among other things, that retail
shops should front on sidewalks and not be
separated from streets by large parking lots),
and various related policies.10 In 1996, Maryland
governor Parris Glendenning applied the term
smart growth to this planning philosophy.11
The transportation rule effectively killed
the idea of expanding urban-growth bound-
aries to make room for growth. In 1993,
Oregon homebuilders asked the legislature
to require that boundaries be expanded to
maintain a supply of land, but Portland plan-
ners convinced the legislature to allow them
to instead accommodate growth by rezoning
existing neighborhoods to higher densities.
In the meantime, Goldschmidt announced
in 1990 that he would not run for re-election as
governor. His decision, which he blamed on
marital issues, was mysterious, as most people
believed he would have easily been re-elected
and probably gone on to the U.S. Senate.
Portlanders later learned that the woman he
had seduced when she was a teenager was seek-
ing a settlement—he eventually paid her
$350,000—and he feared the statutory rape
would be made public.12
Out of office, Goldschmidt immediately
started a political consulting firm that eventu-
ally became known as Goldschmidt Imeson
Carter. Early clients included Bechtel, Nike,
and Weyerhaeuser. Goldschmidt used his
many federal, state, and local political contacts
to grease the skids for those companies to
operate in Oregon’s regulatory environment.
Goldschmidt also used his political muscle to
have friends, relatives, and political protégés
appointed to various high offices.
The resulting light-rail mafia shaped
Oregon’s integrated land-use and transporta-
tion planning system to favor Goldschmidt’s
clients and friends. Some of the members of
the mafia included:
•Bechtel Corporation—Goldschmidt arranged
for Bechtel to receive a no-bid contract to
build an extension of Portland’s light-
rail line to the city’s airport. Under the
contract, Bechtel was paid $95 million
and given a 99-year lease to 120 acres of
valuable land near the airport.
•Tom Walsh—Longtime Goldschmidt
friend and co-owner of Walsh Construc-
tion, which specializes in building high-
density housing projects. Goldschmidt
arranged for Walsh to be appointed gen-
eral manager of Portland’s transit
agency. From that position, Walsh hand-
ed out millions of dollars in subsidies to
high-density, transit-oriented develop-
ments, many of which were built by
Walsh Construction.
•Homer Williams—Goldschmidt arranged for
hundreds of millions of dollars of federal
and local subsidies to an urban-renewal
area popularly known as the Pearl
District. Goldschmidt client Homer
Williams built many of the develop-
ments in the Pearl and, later, the North
Macadam District.
•Schnitzer Group and Zidell Marine—Owners
of a large block of former industrial lands
on Portland’s Willamette River waterfront
south of downtown, an area called either
the North Macadam or South Waterfront
district. They hired Goldschmidt to help
them plan a low-rise residential develop-
ment, but Goldschmidt persuaded them
to go for a high-rise development instead.
The development, which is being built by
Homer Williams, is enjoying nearly $300
million in public subsidies.
• Oregon Health Sciences University—
Goldschmidt served on the board of
directors of this nominally public
school that operates a hospital two-
thirds of a mile away and 500 feet above
the Schnitzer-Zidell land. Goldschmidt
persuaded the hospital to build an aer-
ial tramway to access offices and clinics
in the waterfront development and
convinced the Portland city council to
help subsidize this tram, whose cost
ballooned from Goldschmidt’s initial
$5 million estimate to $57 million.13
Goldschmidt’s efforts were not entirely
directed to land-use and transportation issues.
In 2003, he was involved in a shady deal to take
over Portland General Electric, a utility that
served two-thirds of Portland’s residents.14 The
State Accident Insurance Fund paid him a mil-
lion dollars to help shield the government
agency from private competition. Goldschmidt’s
wife was superintendent of Portland’s schools,
which hired Goldschmidt’s brother in a lucra-
4
tive consulting contract. His wife was also a
vice-president of Pacific Power & Light, Oregon’s largest electric utility.15
All in all, Goldschmidt was easily the
most powerful man in Oregon.16 In
response to that power, “the city and the Portland Development Commission went crazy,” observes Lewis & Clark law profes-
sor (and popular blogger) Jack Bogdanski, “throwing money at Goldschmidt clients like there was no tomorrow, making all sorts of dubious deals.”17
Was Portland’s land-use and transporta-
tion planning system nothing more than a
giant real estate scam for Goldschmidt’s
clients and cronies? To help answer that ques-
tion, this paper will first examine some of the
benefits claimed for Portland’s planning sys-
tem and then look at some of the costs.
The Portland Myths
Portland planners and officials have done their best to promote claims that their inte-
grated planning process is successful. In par-
ticular, they say that
1. Investments in transit and land-use
changes promoted by planning rules
have significantly reduced auto use;
2. Transit-oriented developments have
proven commercially successful and
have moved many people out of their
cars;
3. Rail transit has, in turn, stimulated
billions of dollars of land-use devel-
opments;
4. The urban-growth boundary and
other planning rules have significantly
reduced sprawl; and
5. Portlanders love their plans.
Myth #1:
Portland Loves Transit
“Car junkies like me are becoming an
endangered species,” enthused a reporter vis-
iting Portland for the BBC.18 Portland “loves
to ride” transit, said the New York Times.19 But the sad truth is that Portland’s transit num-
bers are little better than mediocre.
More than 97 percent of all motorized passenger travel (and virtually all freight
movement) in the Portland area is by auto-
mobile. Though transit’s share of passenger
travel has fluctuated between 1.8 and 2.6 per-
cent over the past 35 years, it has never made a significant dent in auto usage.
Portland’s transit agency, TriMet, accu-
rately brags that Portland transit usage grew
faster than driving in the 1990s. But it fails to
mention that transit’s share declined in the
1980s, when the region’s first light-rail line
was under construction. In 1980 more than
2.6 percent of motorized passenger travel in
the Portland area used transit. By 1990, that
had fallen to 1.8 percent. Over the next 12
years, it slowly climbed to 2.3 percent but still
remained well below the 1980 level. Since
2002 it has stagnated or slightly fallen.20
Even if it were still increasing, the difference between 1.8 and 2.6 percent means taking less than 1 percent of cars off the road.
Because transit’s major market is com-
muters, many prefer to measure transit by its
share of commuting rather than of total pas-
senger travel. During the 1970s, TriMet made
many improvements in bus service, including
building a downtown transit mall, increasing
bus frequencies, and providing commuters
with park-and-ride stations. Between 1970
and 1980, total transit ridership tripled and
the share of commuters taking transit to work increased from 7.0 to 9.8 percent.21
After construction began on Portland’s
first light-rail line, however, cost overruns
forced TriMet to raise bus fares and reduce
service. By 1990, four years after the light-rail
line opened, only 6.7 percent of commuters
rode transit to work—less than in 1970.
Ridership recovered in the 1990s, but by
2000 the share of commuters using transit
was still only 7.7 percent, well under the 1980
rate. By comparison, buses in Portland’s rival
to the north, Seattle, carried a smaller per-
centage of travel than Portland in 1980, but
were ahead of Portland’s bus-and-light-rail
system in 1990 and 2000.22
Transit works best at taking commuters
to centrally located jobs. In 2001, TriMet was
proud to say that 46 percent of all downtown
Portland workers rode transit to work. Only
11 percent of Portland-area commuters work
downtown, so on a regional level this is not
very important. But transit did help relieve
congestion and parking problems in the
downtown area. By 2005, however, the num-
ber of downtown workers commuting by
transit declined by more than 20 percent,
while the number driving to work increased.
The result was that transit’s share of down-
town commuting fell to just 38 percent.23
One reason for this decline is that TriMet
had to make service cuts due to the 2001
recession. The high cost of new rail lines and
inflexible light-rail mortgage payments
forced the agency to cut deeper than would
have been necessary if it operated a debt-free,
bus-only system.24
High gas prices in 2006 led to record rid-
ership levels for many transit agencies.25 But
due to budget and service cuts, Portland
transit ridership grew by an anemic 0.1 per-
cent.26
Even with adequate budgets, Portland
planners themselves do not predict that their
plans will lead to a huge shift in travel habits.
A 1997 regional plan called for a 70 percent
increase in population densities within the
urban-growth boundary and the construc-
tion of 125 miles of rail transit and scores of
high-density, transit-oriented developments.
Planners projected that these actions would
reduce the share of trips taken by automobile
from 92 percent in 1990 down to 88 percent
in 2040. Since planners also anticipate a 70
percent population increase during that
time, the small decline in driving’s share of
travel would not prevent a huge increase in
traffic congestion.27
In short, Portland’s integrated land-use
and transportation planning has not pro-
duced any miracles for transit. If transit plays
a slightly greater role in regional travel than
in some other cities, it plays a smaller role
than in Portland’s closest peer, Seattle, which
until 2000 had no rail transit.
Myth #2: Transit-
Oriented Development
One of the highlights of any tour of
Portland offered by planning officials is a
visit to one of the many transit-oriented
developments that have sprung up all over
the region. These high-density, mixed-use
developments are supposed to herald a new
lifestyle that uses less land and resources
because people live in multifamily housing or
in homes on tiny lots, walk to shops, take
transit to work, and generally drive far less than people living in traditional suburbs.
Many transit-oriented developments, or
TODs as planners call them, are built right
next to light-rail stations. A typical develop-
ment is four to five stories tall, with shops and
offices on the ground floor and apartments or
condos above. One famous transit-oriented
village, Orenco, was built when a light-rail line
was constructed across prime farmland with
the express purpose of subdividing that land
into a high-density development.
Tour guides usually neglect to mention
several important points about Portland
TODs:
1. They are heavily subsidized, many
receiving tens of millions of dollars of
support in the form of tax breaks,
infrastructure subsidies, below-market
land sales, and direct grants.
2. Despite the subsidies, vacancy rates are
often high, particularly in areas desig-
nated for shops.
3. While these developments may attract
some people who prefer not to drive,
there is little evidence that they have
significantly changed people’s travel
habits.
As previously noted, when Portland’s first
light-rail line opened for business in 1986,
the city zoned much of the land near light-
6
rail stations for high-density development.
Ten years later, city planner Mike Saba sadly
reported to the Portland city council, “we
have not seen any of the kind of develop-
ment—of a mid-rise, higher-density, mixed-
use, mixed-income type—that we would’ve
liked to have seen” along the light-rail line.
City Commissioner Charles Hales noted,
“We are in the hottest real estate market in
the country,” yet city planning maps revealed
that “most of those sites [along the light-rail
line] are still vacant.”28 To correct this, Hales
convinced the council to offer developers 10
years of property tax waivers for any high-
density housing built near light-rail stations.
Over the next decade, the city experienced a
boom in high-density developments, virtually
all of which were subsidized. Even with the
subsidies, planners and developers soon
learned that so-called transit-oriented develop-
ments only work if they have plenty of parking.
For example, the state of Oregon owned
land next to a light-rail station in east
Portland. In 1998, the state sold the land to
developers at below-market prices and develop-
ers received a total of $13 million in subsidies to
build a $31-million, high-density project called
Center Commons. The development provides
less than two-thirds of a parking space per
dwelling unit, but residents handle that by
freely parking on the sidewalk and in areas
clearly marked as fire lanes.29
Despite those problems, the city considers
the project a success. When asked for a defini-
tion of success, an official replied, “When the
construction was completed, the project
became a success.” In other words, “it’s not just
a matter of ‘build it and they will come,’” com-
ments John Charles of the Cascade Policy
Institute; “simply building it is enough.”30
Another development called The Round
is located in the Portland suburb of
Beaverton. Beaverton gave $12.4 million in
subsidies to the developer, who was supposed
to build a retail-office-housing complex sur-
rounding a light-rail station.31 Yet banks
were unwilling to finance a development
with inadequate parking, so the developer
went bankrupt and the project sat half-com-
pleted for several years. Finally, the city found
a new developer who finished it—on the con-
dition that the design would be modified to
include 700 parking spaces. “The key compo-
nent is parking,” said the developer.32 Yet
vacancy rates remained high after construc-
tion, partly because the development still had
parking shortages.33
Another development, Beaverton Creek, is
located next to a huge light-rail park-and-
ride lot. But the parking is open only to light-
rail riders. With little or no parking available
to customers of the ground-floor retail
shops, nearly all of those shops remain
vacant several years after it was completed.
Parking problems also plagued Orenco,
the pride and joy of Portland-area planners.
Planners allowed only limited parking in the
areas closest to the light-rail station, and
more parking further away. As a result, the
areas near the station were the last to be
developed, so most of the residences are not
within walking distance of the station.34 The
developer who built much of Orenco called it
“our nonprofit wing,” implying that his com-
pany only built it so it could get permits to
build more lucrative developments of single-
family homes on larger lots.35
A survey of Orenco residents by Lewis &
Clark College researcher Bruce Podobnik
found that most of them liked the develop-
ment but that few had changed their travel
habits. “Though some have increased their
reliance on mass transit for occasional trips
since moving into Orenco Station, most resi-
dents of the neighborhood report using
alternative modes of transportation far less
than do their counterparts in Northeast
Portland,” says Podobnik. “A key objective,
that of significantly altering resident trans-
portation habits, therefore remains to be achieved in Orenco Station.”36
One of the most embarrassing failures of
Portland’s transit-oriented planning was
Cascade Station, an office-and-retail park
that was supposed to be built on the 120
acres of land given to Bechtel in exchange for
the company building the airport light-rail
line. Because the land was immediately adja-
7
Even when they
are next to
light-rail stations, transit-oriented developments
only work when they have plenty of parking.
If light rail works
so well, why was a
new garage
needed and in
what sense did
rail stimulate its
construction?
cent to the airport, it was not suitable for res-
idential use, but planners zoned it for small-
box retail—shops no larger than 60,000
square feet—because big-box retail (stores of
100,000 to 300,000 square feet) would be too
“auto dependent.” Although the city spent
$28 million on parks, utilities, streets, and
sidewalks, no one wanted to lease a small
shop or office on a site that was miles from
any residential areas, so the area remained
vacant for five years after the light-rail line
opened in 2001.37
Rail skeptics were amused that every light-
rail car going to and from the airport duti-
fully stopped at both of Cascade Station’s rail
stations, even though no one wanted to get
on or off. Apparently, not stopping would
have disrupted the schedules. Critics were
even more amused when a passenger did
board the rail car one day: a coyote looking
for solitude aboard one of TriMet’s empty
trolley cars.38
Finally, planners caved in to developers
who insisted that small-box retail made no
sense at the site. Instead, the city has persuad-
ed Ikea to build a 280,000-square-foot store on
the site and hopes to attract at least one other
big-box store (though not one headquartered
in Bentonville). Apparently, cheap Asian-made
goods sold by a Scandanavian retailer are
more politically correct than cheap Asian-
made goods sold by an Arkansas retailer.
Though Ikea will deliver purchases to any cus-
tomers who arrive by light rail or stow their
bikes in one of the mandated 75 bike racks,
the store expects most of its customers to use
one of its 1,200 parking spaces.39
Myth #3: Development-
Oriented Transit
Portland planners believe in the “field of
dreams”: “Build it, and they will come.”40
TriMet claimed that Portland’s first light-rail
line stimulated more than $1 billion worth of
development.41 After Portland built a down-
town streetcar line, planners claimed that it
stimulated $2.3 billion worth of develop-
ment.42 And after Portland’s aerial tram was
built, planners claimed it generated $1 bil-
lion worth of development.43
The first problem with these claims is
planners’ assumption that correlation proves
causation. In counting developments sup-
posedly “stimulated” by transit, planners
simply added up all the value of develop-
ments within a few blocks of transit lines or
stations. They made no attempt to insure that the developments really had anything to do with transit.
Measured by value, the vast majority of
the $1 billion of investments supposedly
stimulated by the light rail consists of gov-
ernment buildings, some built in response to
executive orders by President Clinton and
Oregon’s Governor Barbara Roberts that all
federal and state agencies should relocate to
downtown areas.44 One government-funded
building supposedly stimulated by the light-
rail line was a $5 million downtown parking
garage. If light-rail works so well, why is a new
garage needed and in what sense did light rail
stimulate the construction of that garage?
The second problem with claims that tran-
sit stimulated new development is that they are
based on double counting. For example, the
streetcar and aerial tram both serve the same
area, so all of the $1 billion in development
supposedly stimulated by the aerial tram is
included in the $2.3 billion in development supposedly stimulated by the streetcar.45
The biggest problem with the claim that
transit stimulates development is that most of
the private developments themselves received
huge subsidies. The Portland Development
Commission (the city’s urban-renewal agency)
uses tax-increment financing and federal
grants to subsidize developments in urban-
renewal areas. In recent years, those areas have
focused on transit zones and corridors. (For a
description of how tax-increment financing works, see “Problem #3” below.)
The Portland streetcar, for example, trav-
els almost entirely within the River, South
Park Blocks, and North Macadam urban-
renewal districts. New developments in these
districts received more than $665 million of
8
tax-increment financed subsidies from the
Portland Development Commission. The
North Macadam District, which received at
least $289 million of these subsidies, is also
the location of the aerial tram. It is fair to say
that the subsidies played a much larger role
in redevelopment than a 7-mile-per-hour
streetcar line or 13-mile-per-hour tram.
Other subsidies include Federal Transit
Administration grants to transit-oriented
developments; U.S. Department of Transpor-
tation grants for “congestion mitigation,” and
(as previously mentioned) below-market land
sales and 10-year tax waivers for high-density
housing.46 When tax-increment finance dis-
tricts aimed at supporting new light-rail lines
are added, subsidies to Portland-area transit-
oriented developments probably come close to
$2 billion, not counting the cost of light rail,
streetcars, or other transit projects.
Portland’s story of spending $90 million
on a streetcar line to get $2.3 billion of devel-
opment, or $57 million on an aerial tram to
get $1 billion of development, sounds attrac-
tive to officials from other cities. It might not
sound so attractive if Portland admitted that
it really had to spend $665 million, in addi-
tion to the cost of the streetcar line and tram,
not to mention 10-year tax waivers on at least
$100 million of development, to get that $2.3
billion worth of development.
“It is a myth to think that the market will
take care of development along transit corri-
dors,” said Portland City Commissioner
Charles Hales in 1996, when he proposed to
subsidize such developments.47 “The $55
million streetcar line has sparked more than
$1.5 billion (and growing) in new develop-
ment,” said consultant Charles Hales 10
years later, working to sell streetcars to other
cities and conveniently forgetting about the
subsidies he promoted when he was on the
city council.48
“Look at all the cranes in the city,” says
developer Homer Williams. “Outside of two or
three exceptions, it’s all because of the street-
car.”49 Yes, because of the streetcar and the
hundreds of millions of dollars in subsidies in
the areas served by the streetcar. While transit
may be a catalyst for subsidies to develop-
ment, it is not itself a catalyst for development.
Myth #4:
Portland Curbed Sprawl
Even if Portland’s integrated land and
transportation planning is not changing
people’s travel habits, planning advocates
content themselves with the thought that
Portland is at least preserving farmland and
curbing sprawl. After all, according to the
Census Bureau, between 1990 and 2000, the population density of the Portland urbanized area increased by 10.6 percent.50
One problem with this reasoning is that
many urban areas that have no urban-growth
boundaries increased their densities by even
more than 10.6 percent. During the 1990s,
Kansas City’s density increased by 39 percent;
Phoenix’s by 34 percent; Dallas-Ft. Worth’s by
33 percent; San Antonio’s by 26 percent; Houston’s by 20 percent; and Orlando’s by 13 percent.51 One reason for these increases is
that the Census Bureau changed its definition of urbanized area so as to eliminate vacant lands that had previously been included.
Another reason for Portland’s increased
density is that much of the growth took place
as “infill” on prime farmlands, such as
Orenco, that happened to be inside the
region’s urban-growth boundary. This sug-
gests that planners are not so much protect-
ing farmlands as determining which farmers get to enjoy windfall profits because they are inside an imaginary line.
At the same time that newcomers
increased the Portland area’s density, large
numbers of other people escaped Portland’s
planning system by moving to Vancouver,
Washington; Salem, Oregon; and other com-
munities outside the reach of Portland plan-
ners. As land-use rules drove up housing
prices, many people with Portland-area jobs
moved to communities outside the bound-
ary. “Middle-class people are moving to the suburbs for bigger houses,” admits Portland city commissioner Erik Sten.52
9
Rail transit is not
a catalyst for
development; it is a catalyst for
subsidies to
development.
Thanks to
planning-induced
housing
shortages, the
fastest growing
city in the
Portland area is
Vancouver,
Washington.
Between 1990 and 2000, Portland grew by
21 percent, while its Oregon suburbs such as
Beaverton and Gresham grew by 30 to 40 per-
cent. Meanwhile, Vancouver, Washington—
directly across the Columbia River from
Portland but beyond the reach of Portland
planners—grew by 210 percent.53 Though
Vancouver started the decade with barely 10
percent of Portland’s population, it actually
gained more new residents during the 1990s
than the city of Portland.
Meanwhile, 45 miles south of Portland,
Salem grew fast enough to overtake Eugene as
Oregon’s second-largest city in 2001. Like all
Oregon cities, Salem has an urban-growth
boundary, but planners there were less aggres-
sive than in Portland and so Salem’s housing
market has remained more affordable.54
Rather than preventing sprawl, Portland’s
planning has to some degree accelerated it.
Instead of leading people to drive less, the
plans are forcing people to commute long
distances to find affordable housing.
Myth #5:
Portlanders Love Planning
Portland’s planning represents “true
direct democracy in action,” says the BBC.55 Hardly: Several recent elections and other events have seen defeats for the planners, but they continue to plan anyway.
• In 1995, planners began rezoning
neighborhoods to higher densities. The
first neighborhood targeted for densifi-
cation was Oak Grove, where I lived at
the time. When planners held public
hearings to find out how residents felt
about the plan, they were confronted by
hundreds of angry homeowners. Local
government officials reluctantly asked
Metro, Portland’s regional planning
agency, to take Oak Grove off the list of
neighborhoods slated for rezoning, say-
ing “there is no community support”
for the plan.56 Metro and other local
governments responded by not holding
public hearings in most other neigh-
borhoods slated for densification.
Instead, plans were written by commit-
tees consisting of a few neighborhood
residents who were prescreened to
insure they supported Portland’s densi-
fication, along with many more nonres-
idents, such as officials representing
TriMet and other government agencies.
• In 1997 voters in the Portland suburb
of Milwaukie recalled their mayor and
a majority of their city council from
office because the council had
approved a plan to rezone part of the
city for higher densities.57 Planners
were greatly relieved when no other city
followed the suburb’s example.
• Public hearings held in 1998 on light-
rail expansion plans revealed planners’
lack of commitment to the democratic
process. At the first few hearings, plan-
ners intimidated anyone who attempt-
ed to distribute anti-light-rail litera-
ture, even just copies of their testimo-
ny, by threatening them with arrest for
“criminal trespass.”58 Metro changed
this policy after it realized that the First
Amendment allowed people to express
their opinions at public hearings.
• In November, 1998, Portland-area vot-
ers rejected, by 47-to-53, the proposed
expansion to the light-rail system. Yet
TriMet is expanding anyway, using tax-
increment financing—the only way
local officials in Oregon can use prop-
erty taxes without a public vote—to
finance the new lines.
• In 2002 planning opponents put a mea-
sure on the ballot that would forbid
Metro, Portland’s regional planning
agency, from requiring that more neigh-
borhoods be rezoned to higher densities.
Having already densified dozens of
neighborhoods, Metro responded with
its own measure that put a moratorium
on densification through 2015.
Planning advocates claimed victory
when Metro’s measure won—but if they
had really believed that voters supported
10
their density plans, they would simply
have opposed the original anti-density
measure.
• In 2004 property-rights activists put
measure 37 on the ballot, allowing any-
one whose property values had been
reduced by planning and zoning to ask
for either compensation or to have the
rules waived. Planning advocates spent
$2.7 million to argue that this would
destroy Oregon’s land-use planning
system. Though measure 37’s support-
ers spent barely a third of that amount
promoting it, the measure passed by 61
percent, winning a majority of the votes
in every county in the Portland area.
• In 2005 Portland’s incoming mayor,
Tom Potter, announced a “VisionPDX”
process that would allow Portland resi-
dents to “create a vision for Portland
for the next 20 years and beyond.”59
After collecting people’s opinions for
more than a year, a draft report revealed
significant uneasiness with the
Portland’s plans. Respondents “worry
about a growing gap between
Portland’s haves and have-nots—in
schools, health care and the priorities
of city government,” says the draft. In
particular, many people think “the
tram/South Waterfront/North Macadam
development (not to mention the Pearl,
which seems to have become a verb, as
in ‘to Pearlize’) was a total waste of
money.”60
Far from representing direct democracy in
action, Portland’s programs are a classic
example of arrogant government planners
doing their best to sidestep the public’s wish-
es. “Portland-area residents have not know-
ingly consented to be willing research sub-
jects in a radical experiment,” warned a
Portland State University professor of urban
studies in 1995.61 The Goldschmidt affair
revealed that, not only was Portland’s plan a
radical experiment, it was manipulated by
special interests to maximize the profits of
selected developers and rail contractors. The
only question left is how Portlanders will
overturn the dominant paradigm.
Problems with
Portland’s Plans
The previous discussion has already hinted
at some of the major drawbacks of Portland’s
integrated land-use and transportation plan-
ning. These include the following:
1. Increasingly unaffordable housing
prices.
2. Increased traffic congestion.
3. Higher taxes or reduced urban services
as tax revenues are diverted to rail tran-
sit and transit-oriented development.
4. A reputation for having an unfriendly
business environment, leading to
higher unemployment.
Problem #1:
Unaffordable Housing
During the 1990s, housing affordability
declined by more in Portland than in any other
urban area in the United States. Today, Portland
remains more affordable than most California
housing markets, but it is far less affordable
than many less-regulated housing markets,
such as Atlanta, Raleigh, and Houston.
A standard measure of a region’s affordabil-
ity is median home price divided by median
family income. A price-to-income ratio of 2 or
less is very affordable, whereas markets with
ratios above 3 verge on unaffordable. At cur-
rent interest rates and a price-to-income ratio
of 3, a family devoting a quarter of its income
to mortgage payments would need 17 years to
pay it off. At a ratio of 4, it would need 32 years,
and at a ratio of 5, it could never pay it off.
The decennial census estimates both medi-
an family income and median home value for
the year prior to each census. Census data reveal
that almost all U.S. regions outside of Hawaii
(which passed growth-management planning
legislation in 1960) had affordable housing in
11
Far from
representing
direct democracy in action,
Portland’s
programs are a classic example of arrogant
government
planners doing their best to
sidestep the
public’s wishes.
In 2005, planners
were elated to
find that, thanks
to housing that
they made
unaffordable,
developers were
voluntarily
tearing down
suburban homes
and replacing
them with
high-density
housing.
1969. During the 1970s, many counties in
California imposed urban-growth boundaries and other growth-management tools. By 1979, most California housing prices had become as unaffordable as those found in Hawaii.
Oregon urban-growth boundaries were imposed in 1979-85, but a severe recession that caused the state to actually lose popula-
tion during some years in the 1980s kept housing affordable through 1989. As the state’s economy recovered after that year, prices rapidly accelerated.
Growth boundaries limit the supply of
land available for new home construction. In
1990, builders could buy an acre suitable for
residential use in the Portland area for
$25,000.62 By 1997, the cost of the same acre
was between $150,000 and $200,000. Because
median incomes had not increased signifi-
cantly, the National Association of Home
Builders ranked Portland the second-least
affordable housing market in the country.63
Growth boundaries are not the only cause
of unaffordable housing. Other problems
include impact fees and an onerous permitting
process that allows anyone in the state to chal-
lenge a proposed development without hiring
an attorney. One result of this regulation is
reduced competition in the housing market.
“The urban growth boundary has really been
our friend,” says a leading Portland home-
builder. “It kept the major builders out of the
market.”64 Of course, in this case what is good
for homebuilders is bad for homebuyers.
In 1989, Portland’s value-to-income ratio
was less than 2. By 1999, it had increased to
more than 3. It was no fluke that this increase
was greater than that of any other U.S. urban
area: the second- and third-greatest increases
were in Salem and Eugene, Oregon. Today, as
noted in the discussion of Mayor Potter’s
VisionPDX, housing affordability is a major
concern for many Portland-area residents.
Unaffordable housing hits low-income
families particularly hard. With the growth
boundary limiting new home construction,
many young families are gentrifying low-
income neighborhoods in Portland, pushing
former renters in those neighborhoods out
of single-family homes and into multifamily
housing.65 “People who don’t have choices are getting pushed out as rents go up,” says city commissioner Eric Sten.66
Although planners never actually said they
wanted to increase housing prices, it is not
clear that they see high prices as a problem. “If
people want a compact urban area,” said
Metro’s chief land-use planner in 1996, “some
increase in the price of housing is going to
occur.”67 Higher prices would discourage peo-
ple from living in homes with large yards and
encourage more people to live in multi-family
housing, which planners considered to be a
good thing. In 2005, planners were elated to
find that land and housing prices had gone so
high that—without any subsidies—developers
were tearing down suburban homes and
replacing them with high-density housing.68
Yet high housing prices cause several serious
problems. First, they deny low-income families
the opportunity to achieve the American dream
of homeownership. “Insidiously, the burden of
site-supply restrictions will fall disproportion-
ately on poor and minority families,” says
Portland economist Randall Pozdena. Pozdena
estimates that if Portland’s planning measures
had been applied nationwide during the 1990s,
more than a million young and low-income families would have been prevented from buy-
ing homes.69
High housing prices may create windfall
profits for some homeowners—but it is mere-
ly a paper profit unless they plan to sell and
then move to a lower-cost region or a smaller
home. However, this windfall, too, is
inequitable, as the people buying their first
homes tend to be less wealthy than those who already own their homes.
High housing prices also slow the growth of
urban areas. Silicon Valley saw an exodus of
firms to the Portland area in the early 1990s,
when Portland was still affordable. But by
2000, Portland’s high housing prices led many
potential employers to look to Boise, Omaha,
or other affordable communities.
Research in Britain, which has practiced
growth management since 1947 and suffers
from some of the highest housing prices in
12
the world, found that neighborhoods with
high homeownership rates tend to have
higher unemployment rates than communi-
ties with high rental rates.70 High housing
prices make the cost of moving unaffordable,
effectively immobilizing the population.
Harvard economist Edward Glaeser has
found that growth management makes both
housing prices and local employment rates
more volatile. “In the long run, firms general-
ly leave high-cost areas,” says Glaeser, so
“places with rapid price increases over one
five-year period are more likely to have
income and employment declines over the
next five-year period.”71 It is not surprising,
then, that in much of 2001 and 2002
Portland had some of the highest unemploy-
ment rates of any major metropolitan area.72
Problem #2: Congestion
Between 1982 and 2003, the amount of
time the average commuter wasted in traffic
increased more rapidly in Portland than in
Atlanta, Boston, Denver, Los Angeles, New
York, Phoenix, or San Francisco—more, in
fact, than in almost any other U.S. urban
area.73 This was not an unintended conse-
quence of Portland’s planning—in fact, it was part of the plan.
Increased congestion will “signal positive
urban development,” says a 1996 report from
Portland’s Metro.74 Three years later, Metro’s
regional transportation plan declared, “trans-
portation solutions aimed solely at relieving
congestion are inappropriate.”75 In fact, Metro
has decided that “level of service F”—the trans-
portation engineer’s term for near gridlock—is
“acceptable” during rush hour throughout
most of the Portland area. Why? Because, says
Metro’s leading transportation planner, relieving
congestion “would eliminate transit ridership.”76
Following are just a few examples of how
Portland planners are letting congestion increase.
• The biggest bottleneck in the Portland
area is on Interstate 5 between Portland
and Vancouver, just south of the bridge
crossing the Columbia River, where the
three southbound lanes shrink to two
lanes for just 0.8 miles. The result is
huge traffic backups as all the Portland
workers who found affordable housing
in Vancouver try to get to work each
morning. Metro’s 1995 transportation
plan estimated that it would cost only
$10 million to add a third lane to this
segment, but to this date nothing has
been done.77 In 1998, Henry Hewitt,
chair of the Oregon Transportation
Commis-sion, told a legislative commit-
tee that Metro had asked the depart-
ment not to fix the bottleneck.78
• U.S. Representative David Wu (D), who
represents west Portland, earmarked
federal funds to expand state highway
217, which may be the second-most
congested freeway in the Portland area
after I-5. Metro turned the money
down, saying it had other priorities.79
• Portland’s 82-year-old Sellwood Bridge,
the busiest two-lane bridge in Oregon,
is structurally failing and was closed to
trucks and buses in 2004. The Bechtel
Corporation offered to replace the
bridge by 2010, but Metro and
Multnomah County (which owns the
bridge) turned them down. Due to
their lengthy planning processes, they
don’t even expect to begin construction
before 2010.80 When they finally do,
they almost certainly will not add
capacity for anything except bicycles.
• Rather than increase roadway capacity,
Portland is actively reducing the capac-
ity of many arterials and collectors to
handle traffic. Speed humps and curb
extensions have been added to such
collectors as Belmont and Stark streets,
while arterials such as Sandy, Barbur,
and McLoughlin have been slated for
boulevarding, also known as arterial
traffic calming, which means removing
right- and left-turn lanes.
The Texas Transportation Institute esti-
mates that congestion cost Portland-area
13
When U.S.
Representative
David Wu (D)
earmarked funds
to expand one of
the most congest-
ed freeways in
Oregon,
Portland-area
planners turned
the money down.
“While some
poor mentally ill guy lay there with
his life ebbing
away,” blogger
Jack Bogdanski
scathingly
comments,
“the big-shot
real-estate
sharpie sat with
his cloth napkin
on, eating his
braised veal
ravioli with
truffles.”
commuters more than $500 million in wast-
ed time and fuel in 2003, a 1900-percent
increase from 1982.81 A study prepared for
Metro and the Portland Business Alliance
estimates that the cost of congestion to busi-
nesses is of the same order of magnitude.82
In its 2020 regional transportation plan
(published in 2002), Metro predicted that its
plans would increase the amount of time
Portlanders waste sitting in traffic more than
6.6 times.83 Congestion would increase despite
all of the region’s land-use and transit plans
because those programs, predicted planners,
would attract no more than about 4 percent of
auto drivers to other modes of travel.84 When
asked about those predictions, which were in
his own agency’s report, Mike Burton, Metro’s
elected executive, told a legislative committee,
“Nobody believes those numbers.”85
In 2007, the Federal Highway Administra-
tion chastised Metro for its anti-auto trans-
portation plans. “It is difficult to find the
transportation focus” in Metro’s regional
transportation plan. Metro “should acknowl-
edge that automobiles are the preferred mode
of transport by the citizens of Portland,”
added the agency. “They vote with their cars
every day.”86 Based on that “vote,” “The trans-
portation solution for a large and vibrant
metropolitan region like metropolitan
Portland should include additional highway
capacity options.”87
Problem #3:
Increased Taxes/Reduced
Urban Services
On September 17, 2006, developer Homer
Williams was eating dinner on the patio at
the Bluehour, the ritziest restaurant in the
Pearl District, when he saw police subdue a
man on the sidewalk outside. Williams later
told police he was struck by the “casualness”
of the situation.88
It was anything but casual for James
Chasse, the man in custody. A talented musi-
cian who had schizophrenia, Chasse was fine
as long as he took his medications. But a
nonprofit mental health clinic received a
report on September 15 that he was not eat-
ing and had probably stopped taking his
medicine. When someone working for the
clinic tried to find him, Chasse fled in panic.
Two days later, police officer Christopher
Humphries saw Chasse and assumed he was
drunk or on drugs. When Humphries tried to
approach, Chasse ran away. Humphries tack-
led him and, according to witnesses, punched
and kicked him several times.89 While in cus-
tody, Chasse died of chest injuries.
Portland mental health advocates were
outraged that many of the programs that
could have saved Chasse’s life had suffered
recent budget cuts: community policing,90 a
crisis triage center,91 and the city’s mental
health program.92 Yet the city continues to
spend tens of millions of dollars a year subsi-
dizing high-density developments. “So while
some poor mentally ill guy lay there with his
life ebbing away,” blogger Jack Bogdanski
scathingly comments, “the big-shot real-
estate sharpie sat with his cloth napkin on,
eating his braised veal ravioli with truffles.”93
Between 10-year property tax waivers for
high-density housing and tax-increment
financing for transit-oriented developments,
Portland has diverted tens of millions of dol-
lars of tax revenues a year from schools,
police, fire, public health, and other urban
services. This has contributed to funding
crises for many of those services, even as
developers like Homer Williams continue to
enjoy hundreds of millions of dollars in sub-
sidies for their projects.
As of 2003 nearly $1.4 billion worth of property had received tax waivers in Multnomah County (where most of
Portland is located). About $214 million of
that was specifically for Portland’s high-den-
sity or transit-oriented plans, representing
lost tax revenues of about $4 million per year.
Another $600 million is for improvements
and renovations to historic properties. About
60 percent of these improvements, by value,
are near the light-rail or streetcar lines, and
many were counted by Portland planners as
developments stimulated by rail transit.94
14
Portland has 10 urban-renewal districts, at
least 7 of which were created specifically to sup-
port rail transit and transit-oriented develop-
ments. The city uses tax-increment financing
(TIF), a technique first developed to promote
urban renewal in California in 1953. Since
then, TIF has become the primary means of
financing urban renewal in every state but
Arizona. Tax-increment financing provides the
funds used for eminent domain in urban-
renewal areas; without TIF, cases like Kelo v. City
of New London would never have happened.
Originally, urban renewal was supposed to
be a way for cities to kick-start development in
areas so blighted that property owners and
developers would not invest in improvements.
Today, it is often used by planners to shape
development in areas that developers would
gladly invest in without subsidies.95 Planners
use the TIF money to subsidize developments
that are less marketable but more politically
correct than the ones developers would build
without subsidies. Often, that means high-
density, mixed-use developments.
Under tax-increment financing, the exist-
ing property taxes collected from an urban
renewal district are frozen, meaning they are
distributed, as before, to schools and other
services. All property taxes collected on new
improvements—the increment—are used to
subsidize those improvements. In most cases,
planners estimate the revenues they will get
from those improvements, then sell bonds
that will be repaid by those revenues. The
bonds are used to pay for infrastructure,
below-market land sales, and sometimes
direct grants to the developers.
Portland has authorized the sale of $1.7 bil-
lion worth of TIF bonds to support its 10 urban
renewal districts. About $1.2 billion of the
bonds are for the seven districts created specifi-
cally for rail and transit-oriented development.
They include the River District (created for the
streetcar and the Pearl; $234 million), Airport
Way (created for the airport light rail and
Cascade Station; $73 million), North Macadam
(created for the South Waterfront/aerial
tram/streetcar; $289 million), Interstate (creat-
ed for the Interstate light-rail; $335 million),
Gateway (created for the airport light-rail; $164
million), Lents (created for a proposed light rail
to Clackamas County; $75 million), and
Central Eastside (created for a proposed light-
rail line and transit-oriented developments; $66
million).96 It is likely that bonding authority for
the Central Eastside and Lents districts will
increase as plans for those areas progress.
At least some of the money spent on the
districts not created specifically for rail tran-
sit and TODs has still gone to support those
activities. The streetcar was built with the
help of $7.5 million of the $144 million in
bonds for the South Park Blocks District.97
Many of the improvements in that district
and the Convention Center District ($168
million) were counted by planners as invest-
ments generated by rail transit.98
According to Multnomah County, the actu-
al taxes diverted to Portland urban renewal
totaled $66 million in 2006, $41 million of
which went to the rail-TOD districts.99 That
amounts to about 6 to 7 percent of total prop-
erty tax collections in Multnomah County.100
Many of Portland’s suburbs, including
Gresham, Wilsonville, and Tualatin, have their
own urban-renewal districts used to subsidize
their own transit-oriented developments.
The Chasse tragedy symbolized the many
problems caused by the diversion of funds
from schools, police, public health, and other
services. Portland’s schools are particularly
squeezed by tax breaks and urban renewal.
Due to Portland’s high housing prices, a
disproportionate number of families with chil-
dren have moved to suburban or exurban areas
where they can afford a house with a yard. As a
result, only 21 percent of city of Portland resi-
dents are under the age of 18, compared to 27
percent of Portland’s suburban residents.101
While suburban school districts are building
new schools, Portland’s is closing five to seven
schools per year. Despite the closures,
Portland’s school district projected a $57 mil-
lion shortfall in its 2007 budget. Such short-
falls are only driving more families with chil-
dren to the suburbs.102 When Portland’s mayor
suggested a city income tax to help schools, the
idea sank like a lead aerial tram.103
15
Tax-increment
financing
provides the money for
eminent domain
in urban-renewal
areas; without
TIF, cases like
Kelo v. City of New London would
never have
happened.
Though there was
no light rail near
Columbia
Sportswear’s
proposed office
building and
voters turned
down funds to
build it, Portland
planners wanted
to build it anyway
so they told the
company it could
not provide
surface parking
because “it’s a
light-rail station.”
All of these diversions have raised the ire
of the public employees’ unions and others
who work for or rely on the services that are
being cut. These groups are engaged in “a
huge battle for the control of the Rose City,”
observes writer Phil Stanford, author of
Portland Confidential, a book about corrup-
tion in the 1950s and ‘60s. “What’s left of the
old Neil Goldschmidt machine,” says
Stanford, is “struggling to maintain the hold
it’s had on the city’s purse strings.”104
One of the leading opponents of the
Goldschmidt program, City Commissioner
Randy Leonard, represented firefighter unions
before being elected. Since Portland firefight-
ers get more than 90 percent of their funds
from property taxes, they are understandably
concerned about tax-increment financing.105
Another opponent, Amanda Fritz—who chal-
lenged an incumbent Goldschmidt supporter
for city council in 2006—has represented nurs-
es unions. Although Fritz did not win, Leonard
survived a strong challenge from a Goldschmidt
supporter in the same election.
Most recently, groups ranging from the
League of Women Voters to the chair of the
Multnomah County Commission are oppos-
ing an extension of the Portland streetcar that
would require more TIF money. The League
worries that TIF saps spending on schools and
social services. Multnomah County says that
urban renewal costs it $14 million per year.106
In any case, says Stanford, “it looks like the
political machine that’s called the shots in
Portland for almost 50 years is crumbling.”107
Problem #4: Business-
Unfriendly Environment
Columbia Sportswear, one of Oregon’s largest companies, was headquartered in North Portland but wanted to relocate to a larger space. In 2000 it found a location in the Central Eastside urban-renewal district, and the city of Portland was pleased to wel-
come the company there.
After making plans for the new office, how-
ever, the company was told by Portland plan-
ners that it could not have any surface parking
at the site because “it’s a light-rail station.”
There is no light-rail line anywhere nearby,
and voters had turned down funds to build
such a line, but the city hoped to eventually
build the line anyway, so it declared the park-
ing rule to be “nonnegotiable.”108 The compa-
ny moved to suburban Washington County instead, and its CEO blasted the city for its anti-business climate.109
Homer Williams may find Portland to be
a business-friendly environment. But for
those who cannot hire a Neil Goldschmidt to
smooth their way to riches, the cost of doing business in the Portland area is high. That cost includes
• The high cost of land for office, indus-
trial, or retail operations;
• The cost of overcoming Oregon’s
lengthy and onerous land-use planning
process when siting such operations;
• The cost of congestion, especially for
businesses that make daily deliveries of
goods and materials;
• The cost of paying workers enough so
that they can afford housing and other
consumer costs; and
• The high tax rates needed to support rail
transit and other expensive programs.
Portland seemed to have a business-friend-
ly environment in the early 1990s. Housing
was still very affordable, especially when com-
pared to housing in California. In 1993, the
state legislature was prompted by Intel to pass
a law allowing cities and counties to tax only
the first $200 million of the value of chip-mak-
ing plants, which were often worth $1 billion
or more. This seemed reasonable to many
because such factories did not consume any more public services than, say, sawmills or other pre-silicon plants.
As a result, at least 10 chip factories located
in the Portland area, each employing thousands
of people. Between 1992 and 1998, the region
gained nearly 200,000 new jobs, a 26-percent
increase. Then job growth slowed as high prices
for land and housing led employers to look to
16
Boise and other low-cost regions to site new
facilities. At its peak, in December 2000, the Portland area had just under a million jobs. By January, 2004, employment had fallen nearly 8 percent to less than 920,000 jobs. Since then, employment has recovered but today stands only slightly above the 2000 peak.110
Conclusions and
Recommendations
Portland planning did not start out as a real
estate scheme aimed at enriching Neil
Goldschmidt and his friends and clients, but it
ended up that way. Portland’s planning
process was conceived by ideologues who dis-
liked the automobile and wanted to preserve
all of Oregon’s abundant open space no matter
what the cost. It was endorsed by politicians
who refused to believe, or simply ignored, pre-
dictions that it would hugely increase conges-
tion and housing costs. And it was manipulat-
ed by a cabal of politically connected business-
es seeking to divert the flow of tax dollars into
their own pockets. The opportunities for such
manipulation were so obvious that, if Neil
Goldschmidt had not started the light-rail
mafia, it would have been someone else; and if
it were not for Goldschmidt’s statutory rape,
many Portland-area residents never would
have learned about this cabal.
The results have been a disaster for the
average Portland-area resident. The light-rail
and streetcar lines, vibrant downtown streets,
and scenic vistas outside the urban-growth
boundary may seem attractive to visitors. But
residents have to live in unaffordable hous-
ing, creep along in traffic congestion, and pay
higher taxes or suffer reduced urban services
so that the region’s political leaders can fund
their rail transit and transit-oriented devel-
opment schemes.
Portlanders always hoped that planning
would save their region from becoming like
Los Angeles, the nation’s most congested,
most polluted urban area. When Portland
planners were in the midst of writing their
plan for densifying and railifying the region,
they examined the nation’s 50 largest urban
areas to see which was closest to the vision they had for Portland.
It turned out that one region almost pre-
cisely matched that vision. The nation’s dens-
est urban area was also the major urban area
with the fewest number of miles of freeway
per capita. That same area also happened to
be spending billions of dollars building new
rail transit lines. Which urban area was that? Why, Los Angeles.
Despite the popular belief that Los
Angeles is the epitome of urban sprawl, it is
actually the densest urban area in America—
about one third denser than the New York
urban area (which includes southwestern
Connecticut and northeastern New Jersey).
The Los Angeles urban area (which includes
Pasadena and much of Orange County) also
has only about 53 freeway miles per million
residents, compared with a national urban
area average of 108 miles. Los Angeles is con-
gested because it packs so many people into a
small area and doesn’t have enough roads for them to drive on. It is polluted because cars pollute the most in stop-and-go traffic.
“In public discussions we gather the gen-
eral impression that Los Angeles represents a
future to be avoided,” wrote Metro in 1994.
Yet “with respect to density and road per
capita mileage it displays an investment pat-
tern we desire to replicate” in Portland.
Rather than see this as a sign that there
might be something wrong with their plan,
planners merely attributed this to a differ-
ence between “perception and reality.”111
Portland and Oregon can take several steps to remedy Portland’s problems before they get any worse:
• Portland-area voters should dissolve
Metro, the regional planning agency,
and return planning functions to local
governments.
• The state legislature should repeal the
land-use planning laws that are driving
up housing prices and immobilizing
the region’s transportation systems.
• As an intermediate step, the state should
17
The
opportunities for
manipulating the
system were so
obvious that, if
Neil Goldschmidt
had not started
the light-rail
mafia, someone
else would have.
People who want
to see their
regions remain
livable should
look at Portland
only as an
example of how
not to plan.
pass legislation requiring Metro or local
governments to make enough land avail-
able for development at marketable densi-
ties to maintain a 20-year supply of land.
Similar legislation is currently being con-
sidered by the California legislature.112
• As suggested by University of Maryland
public policy professor Robert Nelson,
the state could also pass legislation giv-
ing groups of homeowners and
landowners the ability to opt out of local
land-use planning and zoning by creat-
ing a homeowners’ or landowners’ asso-
ciation that writes its own plans and pro-
tective covenants.113
• The state should also create a regional
tollroads authority that can sell bonds
backed to tolls to build highways to
meet the demand as measured by
motorists’ willingness to pay tolls that
are priced to minimize congestion.
• The region should halt construction of
rail transit lines and other transporta-
tion projects that are not cost effective
in relieving congestion.
•The legislature should eliminate or strict-
ly limit the ability of local governments
use tax-increment financing. At the very
least, such financial support should be
provided to developers only if an area is so
blighted that no development would take
place without initial financial support.
Until these changes are made, cities outside the Portland area should scrutinize Portland’s claims with skepticism. People who want to see their regions remain affordable, uncongested, and livable should look at Portland only as an example of how not to plan.
Notes
1. William Yardley, “City That Loves Mass Transit Looks to the Sky for More,” New York Times, January 29, 2007, p. A15, tinyurl.com/3byffn.
2. Sayeeda Warsi, “Where the Car Is Not King,”
BBC News, August 15, 2006, tinyurl.com/2mmku4.
3. Alan Ehrenhalt, “The Great Wall of Portland,”
Governing, May 1, 1997, pp. 20-24.
4. Auditor’s Office, City of Portland, Oregon, “City
Slogan: ‘The City That Works,’” tinyurl.com/
3yf287.
5. U.S Census Bureau, 1990 Census, Table P107A (median-family incomes) and Table H061A (median home values).
6. George M. Smerk, The Federal Role in Urban Mass Transportation (Bloomington: Indiana University Press, 1991), pp. 120-21.
7. Susan Brody, director, Department of Land
Conservation and Development, “Status of
Transportation Planning Rule,” memorandum to Governor Goldschmidt, July 31, 1989, p. 1, tinyurl.com/3ey585.
8. 1000 Friends of Oregon, “Making the Connec-
tions: A Summary of the LUTRAQ Project,” 1997, pp. 8-10.
9. Land Conservation and Development Commis-
sion, Transportation Planning Rule, Salem, OR:
LCDC, 1991-012-0035(4). A 1998 amendment re-
duced the 30-year goal to 15 percent, tinyurl.com/ 2gyf4c.
10. Transportation Planning Rule, Land Conserva-
tion and Development Commission, OAR 660-012-
0045.
11. John W. Frece, “Twenty Lessons from Maryland’s Smart Growth Initiative,” Vermont Journal of Environ-
mental Law 6 (2004-2005), tinyurl.com/8sj28.
12. Nigel Jaquiss, “Who Knew: Long Before Neil
Goldschmidt’s Secret Became Public, Many Influen-
tial Oregonians Knew Something About It,”
Willamette Week, December 15, 2004, tinyurl.com/ yoxcuy.
13. Jim Redden, “Neil’s Network,” Portland Tribune, May 21, 2004, tinyurl.com/2lcesn.
14. Nick Budnick, “Power Connection: Kulongoski’s
Appointment for Powerful Investment Council Raises
Questions,” Willamette Week, June 7, 2005, tinyurl.com/
29fmkx.
15. Redden, “Neil’s Network.”
16. Bob Young, “Big Dog,” Willamette Week, August 26, 1998, tinyurl.com/2n4gah.
17. Jack Bogdanski, “You See This Sign?” Jack Bog’s Blog, March 20, 2007, tinyurl.com/36v2j7.
18. Warsi.
18
19. Yardley.
20. Federal Transit Administration, “Service Supplied and Consumed,” National Transit Database (Washington: U.S. Department of Transportation, various years); Federal Highway Administration, Highway Statistics (Washington: U.S. Department of Transportation, various years), table HM72.
21. U.S. Census Bureau, 1970 Census, table 82, “means of transportation to work,” for urbanized areas; U.S. Census Bureau, 1980 Census, table 118, “means of transportation to work,” for urbanized areas.
22. U.S. Census Bureau, 1990 Census, table P049, “means of transportation to work,” for urbanized areas; U.S. Census Bureau, 2000 Census, table P30, “means of transportation to work,” for urbanized areas.
23. Portland Business Alliance, “2005 Downtown Portland Business Census and Survey” pp. 3, 11, tinyurl.com/29l38p.
24. Nick Budnick, “TriMet Feels Its Own Squeeze,”
Portland Tribune, June 6, 2006, tinyurl. com/27t6z6.
25. American Public Transportation Association, “Americans Take More Than 10 Billion Trips on Public Transportation for the First Time in Almost Fifty Years” press release, March 12, 2007, tinyurl.com/35a36h.
26. American Public Transportation Association, “APTA Transit Ridership Report: Fourth Quarter 2006,” p. 25, tinyurl.com/2kgt8y.
27. Portland Metro (Metro), “Recommended Alterna-
tive Technical Appendix,” 1994, transportation tables.
28. Quotes from the October 23, 1996, city council meeting are taken from a videotape of that meeting made by the city of Portland, a synopsis of which is available at tinyurl.com/2nhgnj.
29. John Charles, “The Mythical World of Transit-
Oriented Development,” Cascade Policy Institute Policy Perpective no. 1019, October 2001, tinyurl. com/336pt6.
30. Ibid.
31. Aaron Fentress, “Beaverton Pays to Save Round,” The Oregonian, July 23, 1999, p. C1.
32. Richard Colby, “Stalled Project Gets Another Chance,” The Oregonian, June 13, 2001, p. C1.
33. David Anderson, “Opposite Angles on the Round,” The Oregonian, September 21, 2006, p. 12.
34. John Charles and Michael Barton, The Mythical
World of Transit-Oriented Development: Light Rail and the
Orenco Neighborhood, Cascade Policy Institute,
Portland, Oregon, April 2003, tinyurl. com/2kh6s.
35. Randy Gragg, “The New Urbanism: Laboratory Portland,” The Oregonian, June 11, 2000, p. E10.
36. Bruce Podobnik, “Portland Neighborhood Survey
Report on Findings from Zone 2: Orenco” (Portland,
Oregon, Lewis & Clark College, 2002), p. 1,
tinyurl.com/2hhmwo.
37. Kennedy Smith, “Cascade Station Stops Short of New Urbanism,” Daily Journal of Commerce, December 5, 2005.
38. “Wandering Coyote Booted from Airport Hops a Train Instead,” The Scoop, February 15, 2002, tinyurl.com/2gmtat.
39. Jennifer Anderson, “Welcome to Portland? Many
Eagerly Have Awaited Ikea, But Some Critics Say
Any Big-Box Store Is a Bad Idea,” Portland Tribune,
March 27, 2007, tinyurl.com/38k3ke.
40. G. B. Arrington, “At Work in the Field of Dreams:
Light Rail and Smart Growth in Portland”
(Portland, OR: TriMet, 1998), tinyurl. com/394bsd.
41. G. B. Arrington, “Beyond the Field of Dreams,” TriMet, 1996, tinyurl.com/2umsjv.
42. Portland Office of Transportation, “Portland
Streetcar Development Oriented Transit,” 2006,
p. 1.
43. Hal Bernton, “Portland Tram Takes Off,” Seattle Times, January 27, 2007.
44. William J. Clinton, Executive Order no. 12988, Civil Justice Reform, February 5, 1996, and Executive Order no. 13006, Locating
Federal Facilities on Historic Properties in Our
Nation’s Central Cities, May 21, 1996; Barbara
Roberts, Executive Order no. 94-07, Siting State
Offices in Oregon’s Community Centers, June 7, 1994.
45. City of Portland, Office of Transportation, pp. 10-13.
46. Charles.
47. Quoted from the October 23, 1996, city coun-
cil meeting taken from a videotape of that meet-
ing made by the city of Portland. Transcript avail-
able at tinyurl.com/2nhgnj.
48. Charles Hales and Robert Cone, “Streetcars Bring-
ing People, Businesses Back to the City,” HDR
19
TransitLine, 2006, tinyurl.com/2nx6x5.
49. Andy Guy, “The Little Trolley That Could . . . and Did,” Michigan Land Use Institute, November 29, 2006, tinyurl.com/39wt3o.
50. U.S. Census, 1990 Census, table CPH-1 for
urbanized areas; U.S. Census Bureau, 2000
Census, table GCT-PH1 for urbanized areas.
51. U.S. Census Bureau, 1990 Census , table CPH-
1 for urbanized areas; U.S. Census Bureau, 2000 Census, table GCT-PH1 for urbanized areas.
52. Clifton R. Chestnut and Shirley Dang, “Suburbs Drain City Schools,” The Oregonian, October 12, 2003, p. A1.
53. U.S. Census Bureau, 1990 Census, table P-001 for places; U.S. Census Bureau, 2000 Census, table P1 for places.
54. Randal O’Toole, “The Planning Penalty: How Smart Growth Makes Housing Unaffordable,” American Dream Coalition, 2006, p. 44, tinyurl. com/24eksw.
55. Warsi.
56. Judie Hammerstad, chair, Clackamas County Commission, letter to Metro regarding Oak Grove, July 24, 1996.
57. R. Gregory Nokes, “Milwaukie Recall Wake-Up Call for Region’s Planners,” The Oregonian, December 22, 1997, p. A14.
58. I was threatened with arrest for passing out my testimony at a hearing on April 8, 1998. Metro plan-
ners called sheriff ’s deputies, but by the time they arrived I had given a copy to everyone who wanted one. At the next hearing, on April 13, Metro denied that it threatened anyone with arrest.
59. City of Portland, “Welcome to VisionPDX,” tinyurl.com/3d43kp.
60. Joseph Rose, “Survey Finds Have, Have-Not Gap,” The Oregonian, February 15, 2007.
61. Ken Dueker, “Portland’s Love Affair with Light Rail: Assessing the Risk Factors,” Portland State University Center for Urban Studies Discussion Paper no. 95-6, 1995.
62. Foster Church, “Portland Becomes Pricey,” The Oregonian, July 31, 1995, p. A1.
63. R. Gregory Nokes, “Portland Housing Ranks as 2nd Least Affordable in U.S.,” The Oregonian, July 19, 1997, p. A1.
64. Jonathan Brinckman, “Builder Thrives within
Boundaries,” The Oregonian, September 1, 2005.
65. Portland Coalition for a Livable Future, “Displace-
ment: The Dismantling of a Community,” 1999, p. 21.
66. Chestnut and Dang, p. A1.
67. R. Gregory Nokes, “Battle Builds on House Prices,” The Oregonian, April 13, 1996, p. A1.
68. Dana Tims, “Land Value ‘Tipping Point’ Hits Suburbs,” The Oregonian, October 20, 2005.
69. Randal J. Pozdena, “Smart Growth and Its Ef-
fects on Housing Markets: The New Segregation,”
National Center for Public Policy Research,
November 2002, p. 40, tinyurl.com/38ybkt.
70. Andrew Oswald, “Theory of Homes and Jobs,” working paper, University of Warwick, September 18, 1997, tinyurl.com/2pfwvv.
71. Edward Glaeser, “The Economic Impact of Re-
stricting Housing Supply,” Rappaport Institute, 2006, p. 1, tinyurl.com/rmynm.
72. Bureau of Labor Statistics, “Metropolitan Area Employment and Unemployment: January 2002,” tinyurl.com/2eeq9b.
73. David Schrank and Tim Lomax, “The 2005 Urban Mobility Report,” Texas Transportation Institute, May 2005, p. 18, tinyurl.com/3bbr79.
74. Metro, Regional Transportation Plan Update, 1996, p. 1-20.
75. Metro, 1999 Regional Transportation Plan, 1999, p. 638.
76. Metro, “Minutes of the Metro Council Transpor-
tation Planning Committee Meeting,” July 18, 2000,
p. 7.
77. Metro, Regional Transportation Plan, 1995, p. 5-17.
78. Henry Hewitt, chair, Oregon Transportation Commission, Testimony before the State Senate Natural Resources Committee, April 1, 1998.
79. James Mayer, “Wu’s Offer of Highway Money
Creates a Pileup,” The Oregonian, July 3, 2006, p. E1.
80. Anna Johns, “This Bridge Is Building Bridges,” Portland Tribune, November 28, 2006, tinyurl.
com/yoewq3.
81. David Schrank and Tim Lomax, “Performance Measure Summary for Portland,” Texas Transpor-
tation Institute, 2005, p. 2.
20
82. Economic Development Research Group, “The
Cost of Congestion to the Economy of the Portland Region,” December 2005, p. ES-1.
83. Metro, 2020 Regional Transportation Plan, 2002, p. 5-4.
84. Metro, Region 2040.
85. Mike Burton, executive officer, Metro Regional Government, Testimony before the State Senate Natural Resources Committee, April 1, 1998.
86. James Mayer, “Where Are the Roads? U.S. Asks Metro,” The Oregonian, January 30, 2007.
87. Jim Redden, “Metro at Odds with Officials on
Highways,” Portland Tribune, February 13, 2007.
88. Portland Police Bureau, “Death Investigation:
Interview with Homer Williams,” tinyurl.com/
22czks.
89. Steve Duin, “The Fix Is In,” The Oregonian, Octo-
ber 21, 2006; tinyurl.com/ 2rzcnm.
90. City Club of Portland, “Community Policing in Portland,” 2003, p. iii; tinyurl.com/yh9jk6.
91. Rosie Sizer, “The Death of James Chasse Jr.,” The
Oregonian, October 25, 2006, tinyurl.com/yme6bz.
92. Maxine Bernstein, “Files Detail Chasse’s Final Days,” The Oregonian, November 10, 2006, tinyurl. com/y5oeu6.
93. Jack Bogdanski, “Tale of Two Cities,” November 13, 2005, tinyurl.com/2wqyto.
94. Multnomah County, Oregon, Assessor’s Office,
“Specially Assessed and Tax-Exempt Properties,”
2006.
95. Jennifer Lang, “New Urban Renewal in Colorado’s
Front Range,” Independence Institute, 2007, p. 5.
96. Portland Development Commission, “Urban Re-
newal History Appendix, 2006, tinyurl.com/yo2zde.
97. City of Portland, “Portland Streetcar Capital and
Operations Funding,” 2007, p. 1, tinyurl.com/32jruj.
98. Portland Development Commission.
99. Multnomah County Tax Supervising and Conservation Commission, Annual Report 2006-
07, pp. 49-53, tinyurl.com/366rm4.
100. Ibid.
101. Census Bureau, 2000 Census, table QT-P1 for
Portland and Portland-Vancouver urbanized area.
102. Paige Parker, “Middle Class Losing Faith in
Schools, City,” The Oregonian, March 5, 2006, p. A1.
103. Jim Parker, “Portland Public School Leaders Back Away from Mayor’s School Tax Plan,” KGW News, February 9, 2006, tinyurl.com/2qzzfp.
104. Phil Stanford, “Bitter End Is Near for Political Machine,” Portland Tribune, March 3, 2006, tinyurl. com/26ly33.
105. Multnomah County Tax Supervising and Conservation Commission, p. 19.
106. Nick Budnick, “Adams’ Plan Has Critics,” Portland Tribune, March 13, 2007, tinyurl.com/ 27ttt4.
107. Stanford.
108. Jim Pasero, “The City That Shrinks,”
BrainstormNW, March 2002, tinyurl.com/7kpql.
109. Helen Jung. “Tim Boyle Faces Off with Tom Potter over the City’s Business Climate,” The Oregonian, May 19, 2005, A1.
110. Bureau of Labor Statistics, Portland-Vancouver-
Beaverton MSA Nonfarm Employment, series SMU4138900000000001, tinyurl.com/2mubygb.
111. Metro, “Metro Measured,” May 1994, p. 7.
112. Housing Affordability Act, S303, February 16, 2007, tinyurl.com/2d2jzm.
113. Robert Nelson, “Privatizing the Neighbor-
hood: A Proposal to Replace Zoning with Private
Collective Property Rights to Existing Neighbor-
hoods,” George Mason Law Review 7, no. 4
(Summer 1999), pp. 827-80.
21
OTHER STUDIES IN THE POLICY ANALYSIS SERIES
595. The Massachusetts Health Plan: The Good, the Bad, and the Ugly by David A.
Hyman (June 28, 2007)
594. The Myth of the Rational Voter: Why Democracies Choose Bad Policies
by Bryan Caplan (May 29, 2007)
593. Federal Aid to the States: Historical Cause of Government Growth and
Bureaucracy by Chris Edwards (May 22, 2007)
592. The Corporate Welfare State: How the Federal Government Subsidizes U.S.
Businesses by Stephen Slivinski (May 14, 2007)
591. The Perfect Firestorm: Bringing Forest Service Wildfire Costs under
Control by Randal O’Toole (April 30, 2007)
590. In Pursuit of Happiness Research: Is It Reliable? What Does It Imply for
Policy? by Will Wilkinson (April 11, 2007)
589. Energy Alarmism: The Myths That Make Americans Worry about Oil by
Eugene Gholz and Daryl G. Press (April 5, 2007)
588. Escaping the Trap: Why the United States Must Leave Iraq by Ted Galen
Carpenter (February 14, 2007)
587. Why We Fight: How Public Schools Cause Social Conflict by Neal
McCluskey (January 23, 2007)
586. Has U.S. Income Inequality Really Increased? by Alan Reynolds (January 8,
2007)
585. The Cato Education Market Index by Andrew J. Coulson with advisers
James Gwartney, Neal McCluskey, John Merrifield, David Salisbury, and Richard Vedder (December 14, 2006)
584. Effective Counterterrorism and the Limited Role of Predictive Data
Mining by Jeff Jonas and Jim Harper (December 11, 2006)
583. The Bottom Line on Iran: The Costs and Benefits of Preventive War
versus Deterrence by Justin Logan (December 4, 2006)
582. Suicide Terrorism and Democracy: What We’ve Learned Since 9/11 by
Robert A. Pape (November 1, 2006)
581. Fiscal Policy Report Card on America’s Governors: 2006 by Stephen
Slivinski (October 24, 2006)
580. The Libertarian Vote by David Boaz and David Kirby (October 18, 2006)
579. Giving Kids the Chaff: How to Find and Keep the Teachers We Need
by Marie Gryphon (September 25, 2006)
578. Iran’s Nuclear Program: America’s Policy Options by Ted Galen Carpenter
(September 20, 2006)
577. The American Way of War: Cultural Barriers to Successful
Counterinsurgency by Jeffrey Record (September 1, 2006)
576. Is the Sky Really Falling? A Review of Recent Global Warming Scare
Stories by Patrick J. Michaels (August 23, 2006)
575. Toward Property Rights in Spectrum: The Difficult Policy Choices
Ahead by Dale Hatfield and Phil Weiser (August 17, 2006)
574. Budgeting in Neverland: Irrational Policymaking in the U.S. Congress
and What Can Be Done about It by James L. Payne (July 26, 2006)
573. Flirting with Disaster: The Inherent Problems with FEMA by Russell S.
Sobel and Peter T. Leeson (July 19, 2006)
572. Vertical Integration and the Restructuring of the U.S. Electricity
Industry by Robert J. Michaels (July 13, 2006)
571. Reappraising Nuclear Security Strategy by Rensselaer Lee (June 14, 2006)
570. The Federal Marriage Amendment: Unnecessary, Anti-Federalist, and
Anti-Democratic by Dale Carpenter (June 1, 2006)
569. Health Savings Accounts: Do the Critics Have a Point? by Michael F.
Cannon (May 30, 2006)
568. A Seismic Shift: How Canada’s Supreme Court Sparked a Patients’
Rights Revolution by Jacques Chaoulli (May 8, 2006)
567. Amateur-to-Amateur: The Rise of a New Creative Culture by F. Gregory
Lastowka and Dan Hunter (April 26, 2006)
566. Two Normal Countries: Rethinking the U.S.-Japan Strategic
Relationship by Christopher Preble (April 18, 2006)
565. Individual Mandates for Health Insurance: Slippery Slope to National
Health Care by Michael Tanner (April 5, 2006)
564. Circumventing Competition: The Perverse Consequences of the Digital
Millennium Copyright Act by Timothy B. Lee (March 21, 2006)
563. Against the New Paternalism: Internalities and the Economics of Self-
Control by Glen Whitman (February 22, 2006)
562. KidSave: Real Problem, Wrong Solution by Jagadeesh Gokhale and
Michael Tanner (January 24, 2006)
561. Economic Amnesia: The Case against Oil Price Controls and Windfall
Profit Taxes by Jerry Taylor and Peter Van Doren (January 12, 2006)
560. Failed States and Flawed Logic: The Case against a Standing Nation-
Building Office by Justin Logan and Christopher Preble (January 11, 2006)
559. A Desire Named Streetcar: How Federal Subsidies Encourage Wasteful
Local Transit Systems by Randal O’Toole (January 5, 2006)
558. The Birth of the Property Rights Movement by Steven J. Eagle (December 15,
2005)
557. Trade Liberalization and Poverty Reduction in Sub-Saharan Africa by
Marian L. Tupy (December 6, 2005)
556. Avoiding Medicare’s Pharmaceutical Trap by Doug Bandow (November
30, 2005)
555. The Case against the Strategic Petroleum Reserve by Jerry Taylor and
Peter Van Doren (November 21, 2005)
554. The Triumph of India’s Market Reforms: The Record of the 1980s and
1990s by Arvind Panagariya (November 7, 2005)
553. U.S.-China Relations in the Wake of CNOOC by James A. Dorn
(November 2, 2005)
552. Don’t Resurrect the Law of the Sea Treaty by Doug Bandow (October 13,
2005)
551. Saving Money and Improving Education: How School Choice Can Help
States Reduce Education Costs by David Salisbury (October 4, 2005)