2/10/06 On the Road
I-405 corridor project
By Karen Gaudette
Seattle Times Eastside bureau
Q: Why is it that the state will pour highway funds into the Bellevue area on Interstate 405 while nothing is being said or done about alleviating congestion along the stretch of I-405 south of I-90 to I-5? I am referring to the recent improvements and additions to I-405 at Northeast Eighth, Northeast Fourth and Northeast Sixth streets in Bellevue, and now adding an additional lane in each direction from I-90 to Bellevue.
A: The state Department of Transportation says it'll begin work on congestion relief for the commute from 112th Avenue Southeast to I-90 in 2007. Kim Henry, chief engineer for the state's I-405 corridor program, says the project will add one northbound lane to ease the bottleneck at the I-90 interchange and will, in turn, improve traffic flow between Renton and Bellevue.
In 2008, construction will begin in Renton to add one lane in each direction between I-5 and Highway 169 to ease congestion at the Highway 167 interchange. Henry says the next priority is getting funding to add two lanes in each direction between Highway 169 and I-90.
Visit http://www.wsdot.wa.gov/projects/I405/ to learn more about the I-405 corridor master plan, which calls for more than 300 improvements from Renton to Bothell. One reason all the improvements can't happen at once is funding — the state estimates all the projects will cost close to $11 billion in 2002 dollars, more than the amount it's received so far through gas-tax increases and other sources.
• I-405 in Kirkland
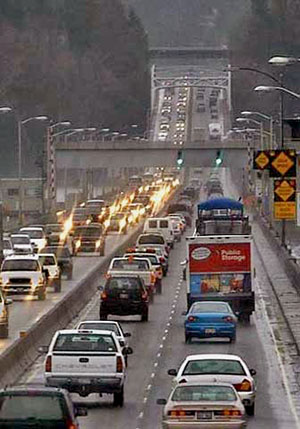
After hearing from many of you upset about bumpy conditions along the Northeast 85th Street bridge deck on I-405 in Kirkland, we followed up with the state Department of Transportation. And good news — the state now plans to repave the stretch this coming summer, rather than in 2008.
Chief engineer Kim Henry said the recent work done on the deck was a temporary fix to deal with a worsening pothole problem and to avoid further deterioration
Transportation
Friday, February 10, 2006
Justifying the 405 expansion at NE 8th


Friday, January 20, 2006
Citizens Guide To WAshington State Budget
Page 1
Budget
A Citizen’s Guide to the
Washington State
Budget
January 2006
Page 2
i
T
ABLE OF
C
ONTENTS
Subject
Page
Introduction...................................................................................1
How Big Is The State Budget?......................................................2
Where Does This Money Come From?........................................3
How Are These Funds Spent By Function?..................................4
How Are These Funds Spent By Object?.....................................6
How Many State Employees Are There?......................................8
What Is The State General Fund?...............................................10
How Is State General Fund Money Spent?.................................12
Why Does The Budget Go Up Year After Year?.......................14
How Is The Budget Created?......................................................14
How Significant Is Government In The Economy?....................17
Why Does The State Borrow Money To Pay For The
Capital Budget? ..........................................................................20
How Does The 601 Spending Limit Work? ...............................26
Glossary Of Commonly Used Budget Terms.............................27
Page 3
1
I
NTRODUCTION
The 2006 Citizen’s Guide to the Washington State Budget is offered
as a resource for citizens, members of the Senate, their staff, and other
interested persons; to provide a clear and simple overview of the state
budget and state revenues. It describes the three basic state budgets and
their interrelationships, the sources of revenue that support those
budgets, how the money is spent, how many staff the state employs, the
timeline for budget decisions and information about state debt and the
Initiative 601 spending limit.
This guide was developed as a response to requests received by the
Senate Ways and Means Committee for a brief and easy-to-understand
document that would explain the state budget to the general public. The
Legislature produces a number of documents and reports that provide
highly-detailed information regarding budget and revenue actions and the
many programs and tax sources contained therein. This guide provides a
pamphlet-style brief introduction to the state budget and taxes.
The 2006 Citizen’s Guide to the Washington State Budget was
prepared by staff of the Senate Ways and Means Committee (within
Senate Committee Services) and the Legislative Evaluation and
Accountability Program (LEAP) Committee, with invaluable assistance
from staff in several state agencies, notably staff of the Budget and
Accounting divisions of the Office of Financial Management (OFM).
Questions regarding the guide or requests for additional copies should be
addressed to:
Senate Ways and Means Committee
101 Modular Building 2
Olympia, Washington 98504-0482
Telephone: 360-786-7715
Fax: 360-786-7615
http://www.leg.wa.gov/senate/scs/wm/default.htm
Page 4
2 How Big is the State Budget?
As of the 2005 Legislative Session, the State of Washington will
spend a total of $58.6 billion for the 2005-07 biennium. That is an
average of $80 million per day during the two-year spending period. This
$58.6 billion includes amounts from three different budgets, which are
plans of how the state will spend the money. The relative size of each of
the three state budgets is shown in the following chart:
2005-07 State Budgets
(Dollars in Billions)
Operating Budget
$49.4
Transportation Budget
$5.9
Capital Budget*
$3.3
Total 2005-07 State Budgets
$58.6
*Excludes Capital Re-appropriations (approximately $2.0 billion).
Sources: Winsum and Buildsum budget development systems for the 2005 Session.
Operating
Budget
84.3%
Transportation
Budget 10.1%
Capital Budget*
5.6%
• The budget that pays for the day-to-day operations of state
government (including federal funds and dedicated funds) is called
the Operating Budget ($49.4 billion).
• The budget that pays for transportation activities, such as designing
and maintaining roads and public transit, is called the
Transportation Budget ($5.9 billion). This budget includes
amounts for both transportation operating activities ($2.2 billion)
and transportation capital activities ($3.7 billion).
• The budget to acquire and maintain state buildings, public schools,
higher education facilities, public lands, parks, and other assets is
called the Capital Budget ($3.3 billion).
Budget-related materials frequently refer to the “state general fund”
or General Fund-State (“GF-S”), which is the largest state fund; it
represents more than half of the $49.4 billion operating budget. A
discussion of the GF-S budget begins on page 10.
Page 5
3
Where Does the Money Come From?
To pay for its activities in 2005-07, the state will tax citizens and
businesses $30.2 billion; receive federal and other grants of $15.8 billion;
collect fees and assess charges for licenses and permits of $9.2 billion;
and borrow $2.9 billion. Other sources, including transfers, account for
$0.9 billion. The relative size of each of these sources is shown in the
following chart:
2005-07 Sources of Revenue
(Dollars in Billions)
Taxes
$30.2
Federal & Other Grants
15.8
Licenses, Permits, & Charges for Services
9.2
Borrowing
2.9
Other Sources (including Transfers)
0.9
Total 2005-07 Sources of Revenue
$59.0
Source: OFM Revsum database for 2005-07 as of December 2005.
Taxes
51.2%
Licenses, Permits, &
Charges for Services
15.6%
Borrowing 4.8%
Federal & Other
Grants 26.8%
Other Sources 1.6%
Most of the money the state uses to pay for services comes from state
taxes. Washington’s major tax sources include the sales tax, the property
tax, and a rather unique tax called the Business and Occupation (B&O)
tax, which is a tax on gross receipts rather than on profit or income.
Washington is one of seven states that do not levy a personal income tax.
When the state projects that expenditures will exceed revenues, it
must take action to address the imbalance. The actions it may take
include: spending reserves; reducing expenditures; increasing revenues;
borrowing money; or some combination of these four actions.
Page 6
4
How are these Funds Spent?
?
The following chart shows how the $58.6 billion 2005-07 total funds
budget is allocated:
2005-07 All Budgeted Expenditures*
(Dollars in Billions)
Human Services
$21.7
Public Schools
$13.8
Higher Education
$9.0
Transportation
$5.6
Governmental Operations
$4.2
Natural Resources
$2.1
Debt Service/Other
$2.3
Total 2005-07 All Budgeted Expenditures*
$58.6
*Excludes Capital Re-appropriations (approximately $2.0 billion).
Sources: Winsum and Buildsum budget development systems for the 2005 Session.
Human Services
37.0%
Public Schools
23.5%
Higher Education 15.4%
Transportation 9.5%
Gov't Operations 7.1%
Natural Resources 3.5%
Debt Service/Other 3.9%
Human Services, such as medical and public assistance, long-term
care, other health care, and prisons, represents 37% of total budgeted
expenditures. Most human services programs are partnerships between
the state and the federal government, with the federal government
providing about half of the money and the state providing the rest. The
state provides human services to one out of every five citizens, including
services to over half a million children residing in Washington.
Public Schools--state funding of kindergarten through twelfth grade
(K-12) school districts--comprises the next largest category of total
budgeted expenditures at 23.5%, although it represents the majority of
the state general fund budget (see page 12).
Higher Education continues at 15.4% of total budgeted spending.
Higher education includes support for state four-year schools and
community and technical colleges.
Page 7
5
Almost $5.6 billion was planned to be spent for Transportation
services and construction in the 2005-07 biennium. These services and
construction include highways, state ferries, and other transportation
programs in the Washington State Department of Transportation (DOT);
the Washington State Patrol (WSP); and the Department of Licensing
(DOL), to name the three largest. Of that $5.6 billion, transportation
operating activities account for more than $2.2 billion (3.8% of statewide
spending), and transportation capital activities account for $3.7 billion
(nearly 6.3% of total spending).
Other major spending categories include Natural Resources
(agencies for environmental protection, management, and recreation);
Governmental Operations (administrative, judicial, and legislative
agencies); and other expenditures, such as the payment of Debt Service
(the interest and principle costs of facilities and services funded through
general obligation bonds).
Page 8
6
How are the funds spent by type of sp-ending
Another way to look at state spending is to identify what the state
purchases. For example, payments to contractors and vendors for
services rendered, and to school districts for K-12 education; salaries and
benefits for state employees; and payments for buildings and lands,
among others. These classifications are called “objects” of expenditure.
The following chart shows large objects of expenditure for fiscal
year 2005, the latest period for which complete object data are available:
Fiscal Year 2005 Expenditures by Object*
(Dollars in Billions)
Grants, Benefits & Client Services
$15.3
Salaries and Benefits
$6.4
Goods and Services
$2.9
Capital Outlays
$1.8
All Other
$1.1
Fiscal Year 2005 Expenditures by Object*
$27.5
*Includes Operating and Capital Budgeted Expenditures.
Source: Monitor database from statewide accounting system.
Percentages do not add due to rounding.
Grants,
Benefits &
Client
Services
55.5%
Salaries & Benefits 23.1%
Goods & Services
10.6%
Capital Outlays 6.7%
All Other 4.0%
As the chart shows, more than half of state spending--nearly 56%--is
for Grants, Benefits and Client Services. Spending on this object
occurs mainly in two agencies: $6.7 billion in the Department of Social
and Health Services (DSHS), as payments to hospitals, nursing homes,
other service providers, and as welfare and child care payments; and $6
billion in the Office of the Superintendent of Public Instruction, as
apportionment and grants to K-12 school districts. Many other federal
and state grant programs have expenditures in grants, benefits and client
services.
Page 9
7
The $6.4 billion Salaries and Benefits expenditure in FY 2005
provided compensation to the nearly 107,000 full-time equivalent (FTE)
staff that the state directly employs. In addition to salaries and wages,
this amount includes health, life, and disability insurance; Old Age and
Survivors Insurance (OASI is sometimes referred to as “Social
Security”); retirement and pensions; and other employee benefits.
The $2.9 billion Goods and Services expenditure in FY 2005 paid
for things like supplies, medications at state-operated hospitals, food at
colleges and universities, and small equipment (valued at under $5,000
per item), as well as services such as data processing, security, rentals
and leases, communications, utilities, printing, insurance, training, and
vehicle maintenance.
The $1.8 billion Capital Outlays expenditure in FY 2005 paid for
highway construction ($561 million), buildings ($424 million), and
furnishings, equipment, and software ($358 million), among others. The
Washington State Department of Transportation (DOT) accounted for
not quite half (47%) of these expenditures, while higher education--the
four-year institutions and the community and technical colleges--
accounted for more than one quarter (28%).
The All Other category of objects includes debt service, personal
service contracts, travel, and transfers for approximately $1 billion.
Page 10
8
How Many State Employees are There?
For budget purposes, the state counts its employees in terms of full-
time equivalent (FTE) staff. One FTE equals 2,088 paid hours per fiscal
year. Generally, one FTE is thought of as one full-time position, although
an FTE may be composed of multiple part-time positions. As the
following chart shows, for the 2005-07 biennium, the state’s budgets
anticipate approximately 106,000 annual FTEs.
Average Annual FTE Staff for 2005-07*
Higher Education
46,231
Human Services
33,404
Transportation
11,052
Governmental Operations
9,419
Natural Resources
5,905
Other
627
Total*
106,639
*Includes FTEs from Omnibus Operating, Transportaion, and Capital Budgets.
Sources: Winsum and Buildsum budget development systems for the 2005 Session.
Higher
Education
43.4%
Human Services
31.3%
Gov't Operations 8.8%
Transportation 10.4%
Natural Resources 5.5%
Other 0.6%
Higher Education represents the largest category of state
employees. The budget for the University of Washington includes nearly
20,000 FTEs and there are over 15,000 FTEs in the budget for the
community and technical colleges. The next largest area is Human
Services. More than 17,900 FTEs work for the Department of Social
and Health Services and almost 8,100 FTEs work for the Department of
Corrections.
Three agencies in Transportation employ 99% of the staff in this
area of state government: Washington State Department of
Transportation (7,344 budgeted FTEs), Washington State Patrol (2,385),
and the Department of Licensing (1,256).
Similarly, in Natural Resources, the largest employers are the
Departments of Fish and Wildlife (1,514 budgeted FTEs), Natural
Resources (1,442 FTEs), and Ecology (1,485).
Page 11
9
In this display, Other includes the Office of the Superintendent of
Public Instruction (OSPI); at 291 budgeted FTEs, it is the only agency in
this category with a budget that exceeds 125 FTEs .
Of the approximately 106,000 budgeted FTEs, the state general fund
will pay for 39%, Higher Education non-appropriated funds will pay for
approximately 26%, federal funds will pay for 13%, and numerous
dedicated funds will pay the remaining 22%.
The nearly 100,000 FTEs of K-12 local school districts are not
included in the FTEs that the state directly employs. However, the state
pays for approximately 70% of the maintenance and operations budgets
of the 296 school districts throughout the state via funds disbursed
through the Office of the Superintendent of Public Instruction.
Page 12
10
What is the state General Fund?
The state general fund is the largest single fund within the state
budget. It is the principal state fund supporting the operation of state
government. All major state tax revenues are deposited into this fund.
The sources of tax revenue for the state general fund are shown in the
following chart:
2005-07 Sources of
State General Fund Revenue
(Dollars in Billions)
Retail Sales
$13.6
Business & Occupations (B & O)
4.8
Property*
2.8
Real Estate
1.6
Public Utility
0.7
All Other
2.9
Total
$26.3
*Excludes transfers to the Student Achievement Account required by Initiative 728.
Source: Economic and Revenue Forecast, November 2004 (Cash Basis).
Numbers do not add due to rounding.
Retail Sales
51.5%
B & O 18.3%
Property 10.6%
Real Estate 6.1%
Public Utility 2.5%
All Other 11.0%
For the 2005-07 budget period, the state general fund will receive
$26.3 billion in revenues. More than half of that amount is from the state
retail sales tax. The second largest tax is the Business and Occupation
(B&O) tax, which accounts for approximately 18%. The third largest tax
is the state property tax, which accounts for nearly 11% of the total.
The state sales tax, the B&O tax, and the state property tax account
for more than 80% of all state general fund revenues. In addition, the
general fund relies on real estate excise taxes, use taxes, a public utility
tax, insurance premium taxes, and a number of other smaller taxes. (For
a description of these and other state taxes, refer to the Washington State
Department of Revenue web site at http://dor.wa.gov.)
Page 13
11
Contrary to popular belief, the state lottery does not pay for a large
share of K-12 education. Currently, the lottery brings in about $200
million per biennium. Initiative 728 (enacted by the voters in November
2000) requires the transfer of these funds to the Student Achievement
Account and the Education Construction Account. Since fiscal year
2005, all lottery revenues have been deposited into the Education
Construction Account. The total state budget for public schools is about
$13.8 billion for 2005-07. This means the state lottery, even if entirely
dedicated to K-12 public schools, would represent only about 2% of the
state budget for K-12 education.
The major difference between the state general fund revenues ($26.3
billion) and the total of all budgeted funds revenues ($59 billion) is the
dedication of revenue sources to specific uses. Most of the difference can
be attributed to four types of funds:
• Federal funds for specific federal programs ($13.2 billion);
• Higher Education-specific funds such as the Grants and Contracts
Account, Higher Education Dedicated Local Accounts, the Tuition
and Fees Account, and the University of Washington Hospital
Account ($5.7 billion);
• Bonds for capital purposes ($2.9 billion); and
• Gas taxes for transportation purposes ($2.1 billion).
These four sources account for 73% of the difference between
revenues available for all state government budgets and the state general
fund budget.
Page 14
12
How is State Money Spent?
Because of the nature of its tax sources, the state general fund
receives the most attention during the budget-building process. During
the 2005-07 biennium, the state will spend about $25.7 billion (or about
$35 million per day on average) from the state general fund. The
following chart shows how the state general fund budget is allocated:
2005-07 General Fund-State Expenditures
(Dollars in Billions)
Public Schools
$10.9
Human Services
9.5
Higher Education
2.9
Governmental Operations
0.7
Natural Resources
0.4
Debt Service/Other
1.6
Total
$26.0
Source: Winsum budget development system for the 2005 Session.
Human Services
36.4%
Public Schools
42.1%
Higher Education 11.2%
Gov't Operations 2.7%
Natural Resources 1.4%
Debt Service/Other 6.2%
The largest single state general fund program is Public Schools,
which includes state support for K-12 education. Public schools account
for 23.5% of total budgeted expenditures, but that share increases to
42.1% when examining only the state general fund. By the end of the
2005-07 biennium, the state will provide public education funding for
more than 1,000,000 children.
Human Services state general fund spending consists primarily of
the operating budget for the Department of Social and Health Services,
the State’s umbrella organization that provides medical, social, and
income assistance to citizens in need. It also includes spending for the
Department of Corrections and the Department of Health.
Higher Education spending includes funding for six public
universities, and thirty-four community colleges and technical schools
serving almost 217,000 FTE students. It also includes financial aid to
Page 15
13
nearly 146,000 students attending both state supported and private
colleges. Expenditures for higher education represent 15.4% of all
budgeted funds and 11.2% of the state general fund. In addition to money
from the state general fund, higher education receives $5.5 billion of
dedicated revenues, principally grants and contracts, and tuition and fees.
Other general fund spending categories include Natural Resources,
Governmental Operations, and other expenditures such as the payment
of Debt Service.
Page 16
1
W
Why does the budget increase annually?
The budget increases each year primarily because there are either
more citizens to serve, those services cost more, and/or because citizens
may request new or different services. Public education may be the
easiest example of these trends.
• Article IX, Section 1 of the Washington State Constitution declares
“It is the paramount duty of the state to make ample provision for the
education of all children residing within its borders ...” The cost of
meeting this constitutional requirement takes nearly half of the state
general fund budget. In 1990, there were about 800,000 children in
Washington state K-12 public schools. By the end of 2003-05, the K-
12 system will educate more than 1,000,000 children. The education
of these additional 200,000 children will cost hundreds of millions of
dollars. Over the same period, the population of the state as a whole
is expected to increase nearly 1.4 million people, so there will be
more taxpayers to shoulder these costs.
• Teaching supplies, materials, equipment and energy all will cost
more in 2006 than they did in 1990, so the overall cost of educating
each student will increase.
• Finally, in 1993, the legislature passed new requirements for public
education. Referred to as “education reform,” these requirements
continue to change the cost of education for each child. This too will
cause the budget to increase.
HOW IS THE
BUDGET
CREATED
?
Through the budget process, the Legislature and the Governor decide
how much money to raise and spend. State agencies, the Governor, the
Legislature, citizens, and interest groups are all involved in this process.
Washington State operates on a two-year (biennial) basis, beginning on
July 1st of each odd-numbered year. For example, the current budget is
for the period July 1, 2005 through June 30, 2007.
Agency Requests - In late summer and early fall of each even-
numbered year, state agencies submit budget requests to the Office of
Financial Management (OFM). The Governor reviews the requests and
makes the final decisions for his or her budget proposal.
Page 17
15
The Governor’s Budget - By law, as the chief executive officer of
the state, the Governor must propose a biennial budget in December of
even-numbered years, the month before the Legislature convenes in
regular session. The Governor’s budget is his or her proposed spending
and taxation plan for the biennium.
The Legislative Budget Process - After receiving the Governor’s
budget proposal, the Legislature reviews it and formulates its own budget
during the legislative session which begins in January. The chairs of the
Senate Ways and Means Committee and House Appropriations
Committee work with their respective members and staffs to analyze the
Governor’s budget and develop recommendations and alternative
proposals. The transportation portions of the budget are developed by
separate committees in the House and Senate. By tradition, the initiation
of the budget alternates between chambers each biennium.
After each chamber has passed its version of the budget, the
differences between the two must be reconciled in the budget conference
process. Generally, six fiscal leaders representing both chambers and
both political parties meet as a conference committee to prepare one
legislative budget that is submitted to the full legislature for final passage
and then ultimately delivered to the Governor for his or her signature.
The Governor may veto all or part of the budget, thereby eliminating
funding for certain activities; however, the Governor cannot add money
for an activity for which the Legislature provided no funding. Only after
the Legislature passes a budget and the Governor signs it has the state
created a real budget.
Supplemental Budgets - Each year, the Legislature considers
changes to the biennial budget in what is called a Supplemental Budget.
Generally, such changes represent mid-course corrections to the two-year
spending plans to account for changes in school enrollments, prison
populations, public assistance caseloads, or significant changes in the
economy of the state.
Page 18
16
Timeline of Budget Decisions
(2005-07 Biennium)
State agencies prepare budget
requests and submit them to
the Office of Financial
Management
The Governor reviews the
requests and makes decisions
about what goes in the
Governor's proposed budget.
The Legislature reviews the
Governor's proposed budget,
develops its own budgets, and
approves revenue bills. The
budget is signed or vetoed by
the Governor.
July 2005
Agencies execute the enacted budget.
January 2006 -
March 2006
January 2007 -
April 2007
The Biennium Begins
July 1, 2005 -
June 30, 2007
Supplemental
Budgets
The 2005-07 biennial budget
may be adjusted in the 2006
and 2007 legislative sessions.
Formulation of
the Governor's
Budget
July 2004 -
December 2004
Legislative
Action on the
Budget
January 2005 -
April 2005
Page 19
17
How significant is state government to the economy
State governments, the federal government, and local governments
represent about 28% of all the economic activity in the country, with the
federal government financing more than two thirds of the public amount.
Government Spending as a share of U.S. gross domestic product (GDP), 2000.
Source: A Citizen's Guide to the Federal Budget, Fiscal Year 2002,
http://www.whitehouse.gov/omb/budget/fy2002/guide.pdf
Private Sector
72%
State & Local
Governments 9%
Federal
Government
19%
nalysis of state and local taxes per capita provides one comparison
of tax burdens among the states. As the following chart shows, for FY
2002 (the most recent year for which all data are available), the amount
FY 2002 Per Capita State and Local Taxes
$954
$971
$740
$598
$1,522
$776
$0
$500
$1,000
$1,500
$2,000
$2,500
$3,000
$3,500
Washington
U.S. Average
Property Taxes
Other Taxes
Sales Taxes
Income Taxes
$3,216
$3,149
$804
Page 20
18
for state and local taxes per capita for Washington State is $3,216,
which is 2.1% higher than the national average of $3,149.
The chart on page 17 shows that the components of the tax structure
of Washington State differ noticeably from national averages.
Washington is one of only seven states that does not impose a personal
or corporate income tax; at the same time, Washington has relatively
high sales taxes and other taxes. According to the Washington State
Department of Revenue, in FY 2002 Washington ranked 20th in the
nation with property taxes per capita of $954 (the national average was
$971).
The chart on page 19 shows the total state and local taxes per capita
for Washington compared to the other 49 states and to the U.S. average.
This chart shows that Washington ranks 16th in state and local taxes per
capita and that 32 states rank below the U.S. average of $3,149.
By comparing taxes to personal income, it should be possible to take
into account differences in wealth among states when comparing tax
burdens. However in recent years, the incredible increase in Washington
State personal income, due in large part to the explosion of stock options
during the late 1990s and 2000, distorted this measure and made it less
useful as a yardstick of the overall tax burden.
Page 21
19
Alabama
Tennessee
Mississippi
Montana
South Carolina
Arkansas
South Dakota
Idaho
Oklahoma
Oregon
West Virginia
Utah
New Mexico
Kentucky
Arizona
Missouri
Florida
Texas
North Carolina
Louisiana
North Dakota
Indiana
Georgia
New Hampshire
Iowa
Kansas
Nevada
Virginia
Michigan
Pennsylvania
Nebraska
Colorado
Ohio
Vermont
Alaska
Illinois
Delaware
Rhode Island
Hawaii
Wisconsin
California
Maine
Wyoming
Maryland
Minnesota
Massachusetts
New Jersey
Connecticut
New York
WASHINGTON
$3,216
U.S. Average
$3,149
0
Why does the sTate borrow money to pay for captial budget
?
The capital budget uses borrowed money to fund projects that benefit
future tax payers. For example, the benefits of a new higher education
facility will last for 30 years or more. Financing that facility with bonds
paid off over thirty years spreads the cost over the life of the building and
on future tax payers who benefit from it.
How Is The Capital Budget Money Spent?
The following chart shows how the 2005-07 total funds capital
budget is allocated:
2005-07 Capital Budget, Total Funds
(Dollars in Millions)
Higher Education
$910
Natural Resources
782
Public Schools
620
Corrections
243
Other*
715
Total
$3,269
Sources: Winsum and Buildsum budget development systems for the 2005 Session.
*Includes agencies in Government Operations, Human Services (excluding Corrections),
Other Education, and some transportation capital projects.
Higher Education 27.8%
Other* 21.9%
Natural Resources
23.9%
Corrections 7.4%
Public Schools 19.0%
The capital budget funds construction and maintenance of state
buildings such as higher education facilities and prisons, provides grants
to local school districts to help build new schools, and pays for
acquisition and maintenance of public lands, parks and other assets. The
capital budget also provides grants and loans to local governments and
community groups for public works projects such as water and sewer
Page 23
21
systems, environmental projects such as toxic waste clean-up and salmon
habitat restoration, and for cultural and recreational projects such as
youth athletic fields and community service projects.
Where Does Capital Budget Money Come From?
The following chart shows the history of size of the capital budget
for bonds and the total appropriation:
Biennium
Bonds
Total
1985-87
518
695
1987-89
604
988
1989-91
923
1,858
1991-93
1,260
1,885
1993-95
1,011
1,712
1995-97
809
1,627
1997-99
961
1,974
1999-01
1,209
2,508
2001-03
1,142
2,641
2003-05
1,499
2,985
2005-07
1,561
3,269
Source: Buildsum budget development system for the 2005 session.
Capital Budget & Bonds
(Dollars in Millions)
0
500
1,000
1,500
2,000
2,500
3,000
3,500
1
9
8
5
-
8
7
1
9
8
7
-
8
9
1
9
8
9
-
9
1
1
9
9
1
-
9
3
1
9
9
3
-
9
5
1
9
9
5
-
9
7
1
9
9
7
-
9
9
1
9
9
9
-
0
1
2
0
0
1
-
0
3
2
0
0
3
-
0
5
2
0
0
5
-
0
7
$ Millions
Other Funds
State Bonds
About half of the money appropriated in the capital budget comes
from the sale of bonds. The State Treasurer is responsible for selling and
Page 24
22
refinancing bonds. The money to pay the debt is appropriated in the
operating budget. These debt service payments, funded with general
taxes, pay for schools, prisons and college facilities authorized and
constructed through capital budgets adopted in previous legislative
sessions. Bond-funded capital projects authorized in a particular
legislative session will be paid for with taxes appropriated in future
operating budgets. Other funds in the capital budget include federal
grants; loan revolving funds, such as the public works assistance account
and the water pollution control revolving account; and trust land
revenues for common schools and higher education facilities.
Different parts of the capital budget are more or less dependent on
borrowed money. Eighty percent of capital projects for higher education
and nearly all projects for corrections are funded with bonds. Only about
a third of the rest of the capital budget is paid for with bonds. The
following chart shows the major parts of the state bond portion of the
2005-07 capital budget:
2005-07 Capital Budget, State Bonds
(Dollars in Millions)
Higher Education
$678
Natural Resources
255
Corrections
241
Public Schools
139
Other*
249
Total
$1,561
Source: Buildsum budget development system for the 2005 Session.
* Includes agencies in Government Operations, Human Services (excluding Corrections),
Other Education, and some transportation capital projects.
Higher
Education
43.4%
Other* 16%
Natural Resources
16.4%
Corrections 15.4%
Public Schools 8.9%
Page 25
23
What is the Debt Limit and How Does it Control the Capital
Budget?
The Washington State Constitution indirectly limits the amount of
debt the state can incur. Annual debt service payments cannot exceed
nine percent of the average general state revenues in the preceding three
years. Taxes and fees for specific purposes, such as the gas tax and
property tax, are excluded from the definition of general state revenues.
The following chart show the constitutional and statutory debt limits
and the actual debt service payments applicable to each limit.
Debt Limit vs Actual Debt Service Payments
(Dollars in Millions)
Fiscal
Year
Limit
Actual
Limit
Actual
1992
489
275
380
271
1993
532
309
414
302
1994
558
371
434
330
1995
583
415
454
360
1996
612
458
476
390
1997
635
477
494
410
1998
656
510
511
444
1999
680
551
529
471
2000
713
588
554
511
2001
748
630
581
548
2002
779
648
606
575
2003
794
650
622
575
2004
799
643
639
568
2005*
807
695
695
614
2006*
840
723
774
643
2007*
918
768
863
684
*2005, 2006, & 2007 are estimates based on current appropriations.
Sources: Debt models from State Treasurer's Office (11/22/2005)
Constitutional
Statutory
0
100
200
300
400
500
600
700
800
900
1000
1
9
9
2
1
9
9
3
1
9
9
4
1
9
9
5
1
9
9
6
1
9
9
7
1
9
9
8
1
9
9
9
2
0
0
0
2
0
0
1
2
0
0
2
2
0
0
3
2
0
0
4
2
0
0
5
*
2
0
0
6
*
2
0
0
7
*
Fiscal Years
$ Million
s
Actual Debt Service Subject
to Constitutional Limit
9% Constitutional Debt Limit
Page 26
24
State law also limits debt. The statutory debt limit is seven percent,
but is based on revenues that include the lottery, real estate excise tax,
and property tax. These additional revenues were added by legislation in
2002 and 2003. The debt service payments limited by state law are also
somewhat different from the payments limited by the constitution. The
statutory limit excludes debt on general obligation bonds reimbursable
from money other than general revenue and several specific projects, but
includes voter-approved debt. The effect of these revenue and payment
differences results in a statutory debt limit that now allows about the
same amount of borrowing as the constitutional debt limit.
How Does the Capital Budget Fund Community Projects?
The capital budget funds a variety of community projects. Some of
these projects are first reviewed and prioritized by a state agency. The
following are some of the larger categories of community projects
funded in the capital budget.
Washington Wildlife and Recreation Program
2005-07 Funding – $50 million
Application/Funding Process - Applications are prioritized within
the following types of projects: local parks, state parks, trails, water
access, critical habitat, natural areas, and urban wildlife. The
legislature then specifies how far down the priority list projects will
be funded.
Administrative Agency & Contact – Interagency Committee for
Outdoor Recreation (http://www.iac.wa.gov/iac/grants.asp)
Community Service Facilities
2005-07 Funding – $5.3 million
Application/Funding Process – Applications are prioritized by a
citizens’ advisory committee based on the level of improved
efficiency and service quality the project would provide to the
community. The grant can’t exceed 25 percent of the total project
cost. The legislature then determines which projects will be funded.
Administrative Agency & Contact – Department of Community,
Trade & Economic Development
(http://cted.wa.gov/DesktopDefault.aspx?tabid=475&tabindex=61)
Page 27
25
Building for the Arts
2005-07 Funding – $5.4 million
Application/Funding Process – Applications are prioritized by a
citizens’ advisory committee. The grant can’t exceed 20 percent of
the total project cost. The legislature then determines which projects
will be funded.
Administrative Agency & Contact – Department of Community,
Trade & Economic Development
(http://cted.wa.gov/DesktopDefault.aspx?tabid=475&tabindex=61)
Heritage Capital Projects
2005-07 Funding – $4.6 million
Application/Funding Process – Applications are prioritized by the
Washington State Historical Society in consultation with others. The
grant can’t exceed 33 percent of the total project cost. The
legislature then determines which projects will be funded.
Administrative Agency & Contact – Washington State Historical
Society (http://www.washingtonhistory.org/wshs/contact.htm)
Other Categories of Community Projects
2005-07 Funding – Varies
Application/Funding Process – In addition to the programs above,
the legislature may fund community projects directly, without an
administrative agency reviewing and prioritizing applications.
Contact – Your legislators
Page 28
26
HOW
DOES
THE
601 SPENDING
LIMIT
WORK
?
In November 1993, the citizens of Washington State passed an
initiative to limit the growth in state government spending and taxation.
Initiative 601 (I-601) put a “cap” on state spending for activities funded
by the state General Fund. The expenditure cap was based on the
amount of state spending in 1990, with annual adjustments for
subsequent population growth and inflation. When General Fund
revenues grew faster than the I-601 spending limit, the extra revenue
could be used to reduce taxes or be put into the “emergency reserve
fund,” which could only be used if two-thirds of the legislature agreed to
use it. When revenues grew more slowly during economic recessions,
the emergency reserve fund could be used to allow spending up to the
state spending limit.
Initiative 601 also requires a two-thirds vote of the Legislature to
approve any legislation that increases state revenue, such as a tax
increase. (However, the 2005 Legislature suspended this requirement
until June 30, 2007.) A vote of the people is required if the tax increase
will result in spending in excess of the state expenditure limit.
Legislation enacted in 2005 made several significant changes to
Initiative 601, to take effect in 2007. Beginning in 2007, the state
General Fund expenditure limit will be expanded to include expenditures
from five additional state funds: the Health Services Account; the
Violence Reduction & Drug Enforcement Account; the Public Safety &
Education Account; the Water Quality Account; and the Student
Achievement Fund. In addition, the annual adjustment to the state
spending limit based on population growth and inflation will be replaced
by a formula reflecting the ten-year average growth in state personal
income.
Page 29
27
G
LOSSARY
O
F
C
OMMONLY
U
SED
B
UDGET
T
ERMS
Appropriation - A legislative authorization for an agency or other
governmental unit to make expenditures and incur obligations: (1) for specific
purposes, (2) from designated funding sources, and (3) during a specified time
period.
Biennium - The 24-month period from July 1st of odd-numbered years to
June 30th of odd-numbered years, such as the 2005-07 biennium, which runs
from July 1, 2005 to June 30, 2007.
Capital Budget - The budget that pays for the construction and renovation
of state facilities, including public schools, prisons, state hospitals, higher
education institutions, parks, etc. Revenues to support capital spending come
primarily from bonds and dedicated cash accounts.
Debt Service - The interest and principle costs of facilities and services
funded through general obligation bonds.
Dedicated Funds - The product of reserving certain tax revenues for a
specific purpose or purposes. Generally, any fund other than the general fund or
a federal fund is referred to as a dedicated fund. There are literally hundreds of
dedicated funds in the state treasury. Two of the largest are the Motor Vehicle
Account, which receives gas tax revenues and is restricted to roads and
highways, and the State Lottery Account, which accounts for revenues from
ticket sales and is reserved for the cost of lottery operations and prizes.
Federal Funds – Monies provided by the federal government to support
state programs. Major operating budget federal programs include Medicaid and
the Social Services Block Grant.
Fiscal Year (FY) - The 12-month period from July 1st to June 30th,
expressed in terms of the first six months of the next calendar year. For example,
the FY 2006 fiscal year runs from July 1, 2005 until June 30, 2006.
FTE Staff - Full time equivalent (FTE) staff is a way to measure the size of
the state’s workforce. One FTE is equivalent to 2,088 hours worked per year,
which represents one full-time employee. Total FTE staff does not necessarily
represent the total number of state employees because some staff work part-time
and are thus classified as a percentage of one FTE.
Governmental Operations - A functional area of state spending which
comprises a large number of central service agencies, such as the departments of
General Administration, Personnel, Financial Management, Revenue, etc., as
well as the legislative and judicial branches of government.
Higher Education - A functional area of state spending that includes the
cost of secondary education and workforce training provided through the state’s
34 community and technical colleges, four regional universities, and two
research universities.
Human Services - A functional area of state spending which comprises
human services agencies such as the Department of Social and Health Services,
the Department of Corrections, and the Department of Health.
Page 30
28
Natural Resources - A functional area of state spending that includes the
state’s natural resource agencies such as the departments of Ecology, Fish and
Wildlife, Natural Resources, and the State Parks and Recreation Commission.
Object - A state accounting classification used to categorize expenditures.
Objects of expenditure in the state operating and capital budgets include:
Salaries and Wages; Employ Benefits; Personal Service Contracts; Goods and
Services; Travel; Capital Outlays; Grants, Benefits, and Client Services; Debt
Service; and various transfer objects.
Operating Budget - The budget which pays for most of the day-to-day
operations of state government and constitutes the majority of all state spending
is referred to as the operating budget. Revenue to support this budget comes
from a variety of taxes and fees that are deposited into more than 200 separate
funds and accounts, the largest of which is the state general fund.
Other Education - A functional area of state spending that includes the
cost of providing specialized education services at the Schools for the Deaf and
the Blind, arts and cultural services provided through the Arts Commission and
the two state Historical Societies, and cost of the state Work Force Training, and
Education Coordinating Board.
Public Schools - A functional area of state spending that includes the cost
of educating the state’s children from grades kindergarten through high school.
It also includes the funding for other activities of the public school system. The
Superintendent of Public Instruction allocates these funds to 296 school districts,
nine educational service districts and other contractors who provide education
services.
State General Fund - Often referred to as General Fund-State (GF-S), this
fund serves as the principal state fund supporting the operation of state
government. All major state tax revenues (sales, business and occupation,
property tax, and others) are deposited into this fund.
Transportation Budget - The budget which pays for both the day-to-day
operation of state transportation agencies and the construction and preservation
of state highways and roads, is called the transportation budget. Most of the
revenue that supports the transportation budget comes from the state gas tax.
Thursday, December 22, 2005
Rail Madness prevails over more urgent priorities
In Seattle, you can't hear those rails a-hummin'.
by TED VAN DYK
Thursday, December 22, 2005 12:01 a.m. EST
SEATTLE--Ah, the Emerald City, temperate of climate, blessed in its natural setting, possessing a rich cultural life and global philanthropy, known for its diversity and tolerance, the nation's best-educated and literate city. My hometown.
But here, as in that other Emerald City in "The Wizard of Oz," there is a dark side. Local governance has come to resemble that in those old movie Westerns--the ones where the powerful get what they want, public officials eat at their trough, and townsfolk eat dust and pay the bills.
Seattle has a long history of providing subsidies to those who least need them. Microsoft co-founder Paul Allen's Vulcan Inc. will receive at least $500 million to help finance its South Lake Union commercial real estate development, to include a touristy trolley line from downtown. The city already subsidizes his Seahawks' football stadium. Owners of the Supersonics basketball team seek up to $200 million.
But nowhere is the misallocation of public money more evident than in public transportation, where Rail Madness eats billions that could otherwise be devoted to truly efficient transportation technologies.
Consider Seattle's version of Boston's Big Dig: The city's downtown bus tunnel is closed--two years ahead of schedule--for rail retrofit. Sound Transit, a regional agency, is obsessed with building a cost-ineffective light-rail system. It is preparing to bore twin tunnels five miles further northward, which will require moving between 121,000 and 167,000 dump-truck loads of dirt. Never mind that voters have not yet approved funds or a plan for a rail system going that far or beyond.
Seattle, once known as the Queen City, used to have interurban trolleys, street trolley cars and cable cars. Rails were ripped up as the postwar motor age took over. Seattle was fortunate, however, to develop an all-bus system between 1970 and 2000, which ranked high among major urban transit systems. Its service remains excellent, although it is diminishing as resources are diverted to rail.
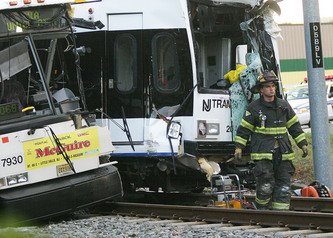
The 1962 World's Fair brought a short monorail line which locals liked as a Seattle thing. (It is plagued by accidents and breakdowns and nearing monorail Valhalla; a recent collision between two cars has the system down again.) A cabdriver and others sponsored a ballot measure calling for construction of a monorail system from Ballard, in the northwest part of the city, to West Seattle, to be paid for mainly with annual taxes to be levied on Seattle car owners. Routing, design and financing details were sketchy.
But elected officials and media jumped aboard. The measure passed, a nonelected governing board was established, and car taxes began to be collected at a $1 million a week rate. We finally killed the scheme last month after a new citywide vote, but car owners will be taxed many months more to pay off the money blown in the planning process by the self-serving board and staff.
Another ballot measure, in 1996, authorized Sound Transit to proceed with light rail. The chairman, during its developing period, was King County Executive Ron Sims; the finance chairman was Seattle Mayor Greg Nickels. Both lashed themselves politically to its mast. The priority became a light-rail system voters were promised would reach from south of Seattle-Tacoma airport to Northgate Mall in the city's northern end.
Rather than starting with a downtown-northward leg where ridership would be heavy, Sound Transit began with a less-busy southward leg. Some 80% of that line's prospective riders already use public transit. Homes and businesses in the mostly poor neighborhoods along the route are being torn down. Taxpayer-provided street money has been passed to favored neighborhood groups who attest to the progress the project is bringing.
The light-rail system, as now projected, will have far fewer stations, be far shorter, take years longer to build, and cost billions more than originally promised. What experts already knew--that light rail is unsuited to cities where tunneling and water crossings are necessary--is now apparent. Big engineering problems have arisen. Yet Messrs. Sims, Nickels, other local officials, Sen. Patty Murray and Rep. Norm Dicks have kept big money flowing to the project.
Washington state law provides that transit agencies and regional transit authorities may operate rail service where it is competitive in cost with bus, bus rapid transit and other technologies. It also requires that least-cost alternatives be presented for comparison to elected officials and voters before transportation technologies are approved. Both Sound Transit's light rail and its intercity Sounder service have cost far more than alternatives, the prices of which were not presented.
Rail Madness came via ballot measure--the form of direct democracy tailor-made for willful, well-financed single-issue and single-interest coalitions to get what they want. Local law firms, financial institutions, unions, consultants, architects, builders and others who receive project-related public funds have formed a strong alliance with local politicians who keep those rails a hummin'. Taxpayer funds even pay for print and broadcast ads hyping the projects.
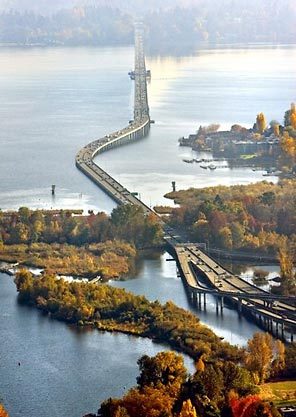
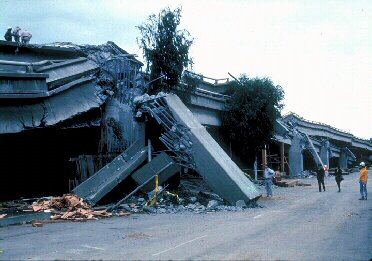
While Rail Madness prevails, more urgent transportation priorities are not being met. The Nisqually earthquake of 2001 undermined and made dangerous two prime arterials here: the Alaskan Way Viaduct, along the city's waterfront, and the Evergreen Point Bridge, connecting Seattle to suburbs east of Lake Washington. State and some federal money finally is available to begin their replacement or repair but billions in local money must be found. The next quake could shake either transportation lifeline down.
On this matter, Seattle's elected leaders know something will turn up. Meantime, the City Council says it will study replacements for the rejected monorail. Buses or their modern cousin, bus rapid transit, might carry more people to more places for fewer tax dollars. But they would be boring and thus unworthy of the Emerald City
Mr. Van Dyk is a Seattle Post-Intelligencer editorial page columnist
Sunday, November 13, 2005
Why BRT is better than Light Rail for the Puget Sound
Bus Rapid Transit for the Metropolitan Puget Sound
Donald F Padelford
Nov 13 2005
Seattle
"We wish we had never started the whole thing. Fixed rail is not the answer to the transportation needs of our city. We should stop all this insanity that has gone on these past years."
Richard Riordan, Mayor of Los Angeles, on public radio program,
"Which Way LA?," June 1998.
The mayor was right, both for his city and for ours. We should stop railing at gridlock and put in place a Bus Rapid Transit system that would
*
Cover the entire metro Puget Sound region at 60 mph 24/7,
*
Have far more capacity than competing systems such as light rail or monorail,
*
Support "walkable," mixed-use neighborhoods, and
*
Set the stage for a total regional mobility solution.
The spine of the Puget Sound BRT system would be comprised of 150+ miles [1] of freeway HOT lanes (described below). Another 100+ miles [2] would be made up of arterial bus-only lanes. Additionally there would be short sections of busways, bus tunnels, and possibly elevated bus-on-rail (guided-bus) structures, similar in size and mass to the existing Seattle Center monorail. Finally Sound Transit’s downtown Seattle to SeaTac Airport "Initial Segment" of light rail, currently under construction, would be converted to guided-bus technology.
HOT lanes (high occupancy / toll) are HOV lanes that have been converted to transit priority and emergency vehicle use [3], with other vehicles admitted, but only to the extent that there is room, via a variable toll. This toll is collected electronically and varies every few minutes [4]. Transit vehicles include buses, vanpools, and qualifying carpools [5]. The objective is to keep the HOT lanes in free-flow (50 to 60 mph) at all times, even during the height of rush hours. Several such systems are in place around the nation [6], and one is being implemented here on Highway 167 south of Renton [7].
Bus-only lanes would be built primarily in the parking strips of major arterials. Gates, such as one finds at parking lots, would keep out non-transit vehicles [8]. These lanes could be rush-hours-only or full time. Particularly if they are full time, it would be necessary to more than replace parking lost to merchants with pubic parking lots or garages, perhaps providing 200% of the parking formerly found on-street [9].
Busways are simply bus streets, such as the E3 Busway south of downtown Seattle. There are times when bus through-put is such that it requires a street rather than a lane. Bus tunnels, of course, are busways that are under ground.
Guided-bus systems are a hybrid of bus and rail systems, having some of the characteristics of each. On the one hand buses ride on (concrete) rails (like some trains in the Paris Metro), producing a smoother ride than is normally found on surface streets [10]. On the other hand they are able to drive off the rails at each end of the track to pick up and drop off passengers. Such guided-bus operations can be on the surface, in tunnels, or elevated. A first-generation guided-bus system, parts of it elevated, was built 20 years ago in Adelaide, Australia. Other systems have been built in Germany and England [11].
Finally, while Sound Transit’s Initial Segment of light rail represents a foolish squandering of literally billions of scarce transportation dollars [12], it is becoming a "sunk cost" which cannot be just abandoned [13]. Therefore the right thing to do is to convert it to a more appropriate technology, such as bus-on-rail (guided-bus), which would dovetail with Bus Rapid Transit in other corridors [14].
BRT Issues
Capacity vs light rail. The plain fact is that Bus Rapid Transit on HOT lanes (BRT/HOT) has more capacity than heavy rail (BART-type) let alone light rail (Portland Max-type) systems. The reason for this is that the capacity of any transit system is determined at the stations. With rail a train cannot, of course, enter the station unless the one before it has left. The time between trains is called the "headway," and it invariably is two or three minutes at a minimum, more on "non-grade-separated" systems (systems running on surface streets and therefore prone to auto and truck interference, such as Sound Transit’s Initial Segment of light rail). With BRT/HOT, however, the transit unit (bus) pulls off the right of way (HOT lane) to discharge and take on passengers. Under these circumstances, you can put a transit unit down the right of way every few seconds rather than every few minutes. [15] (Note that buses on busways also have the ability to unload and load passengers "off-line" in the manner of BRT/HOT.)
Stuck in traffic? As demonstrated around the nation, HOT lanes flow at highway speeds at all times. And because buses and vanpools always have absolute priority, their travel time is guaranteed. Off the freeway, buses on bus-only lanes with traffic signal preemption move without being subject to undue traffic interference. And of course buses on busways or guided-bus structures move at their design speed. [16]
Support for "walkable" neighborhoods. Some proponents of light rail believe that Bus Rapid Transit cannot support "walkable" neighborhoods. However this view is becoming a minority one now that many examples of just such support are showing up around the nation and world. Below is a representative quote, this from a recent "Railvolution" conference in Salt Lake City [17].
"BRT-transit" Oriented Development
Is it really true that you have to have steel wheels to make a good [transit oriented development, ie a "walkable" neighborhood anchored by transit]? Many would suggest that this is a myth - one that can be dispelled by examples from South America, Australia, Canada and the United States. This session will provide an international perspective on how BRT and TOD can and do work together. Learn how TOD can be more than an accidental result of BRT development, but how with attention to design elements and partnerships, BRT actually shapes communities and achieves the same developmental objectives of its steel-wheeled cousins.
O v e r v i e w : Find out the myths vs. realities of whether you really need steel wheels to make a good TOD.
Quality of service. A persistent theme among certain local politicians is that you can’t have a "world class" city region without rail. Possibly this is true if your buses are stuck in traffic, if they "belch" diesel fuel, if their stops are exposed to the weather, and if the buses lurch down the road. But none of these apply to high-quality BRT systems. Being stuck in traffic was dealt with above. As for diesel belching, our buses are increasingly first generation hybrids, and the next generation will be even cleaner and quieter. Stops can and should be the equivalent of rail stations: clean, dry and comfortable, with tickets bought off the bus and boarding level with the platforms [18]. As for lurching, this is a matter of the controls and the roadbed. With modern controls, buses can start and stop as gradually as a train [19]. And the roadbed can be as good as we are prepared to pay for. Of course with busways and guided-bus structures no other vehicles are allowed in the right of way, which aids in their maintenance [20].
Expense vs light rail. This is a big subject, but because most of the right of way (roadbed) is already in place, BRT systems are about a tenth of the cost of light rail in this region. Where light rail has been built economically, such as in San Diego or Salt Lake City, either the rails have already been in place or the topography is such that it’s easy to lay them without condemnations or tunneling [21]. Because it is so much less expensive, for the same budget BRT can cover about ten times the area and support ten times as much Transit Oriented Development ("walkable" neighborhoods) as LRT.
Guided-bus technology. Guided buses are not necessary for BRT. On the other hand, given the money spent to date by Sound Transit, it makes sense to convert their Initial Segment of light rail to a bus-on-rail system (see above). The same technology, because it so accurately guides them, would allow four lanes of buses to pass each other in the Downtown Seattle Transit Tunnel, and thus permit "skip stops" with the consequent doubling of transit through-put [22]. Also, this technology, along with the relatively light weight or buses compared to trains, enables elevated bus structures to be slim and compact, making them a good neighbor to communities along major arterials, such as SR99 (Aurora). While earlier, first-generation systems use a mechanical guide-wheel to steer the buses, today’s guided-bus systems generally use magnetic or optical means of guidance (although mechanical systems may be used as a safety back-up) [23].
Through-put of HOT vs general purpose lanes. This is not strictly a Bus Rapid Transit issue. However, it is germane because it indicates where the technology underlying BRT/HOT could lead. We all know that if you put too many cars on a freeway, it bogs down into gridlock, this due to demand exceeding supply (potential through-put). When this condition prevails for any period of time, the "traffic pipes" in effect contract, causing the highway equivalent of a coronary thrombosis. The fact that this "thrombosis" happens just when supply is needed the most, at rush hours, is doubly ironic. One approach that has had success with this problem is ramp metering, which has markedly increased the through-put of our local freeways. Congestion Pricing, the mechanism behind HOT lanes, could be considered "ramp metering on steroids". If it were applied to all freeway lanes [24] (which, of course, is not necessary for BRT/HOT), it could increase the capacity of our freeway network by up to twice their current rush hours through-put [25].
Bus Rapid Transit is, or should be, the mode of choice for high capacity transit in the metropolitan Puget Sound region. It has far more capacity than competing systems, supports "walkable" neighborhoods, and provides 60 mph transit mobility to the entire metro region 24/7. Furthermore if implemented, it would set the stage for an increase of freeway capacity up to double current rush hours through-put -- with free-flow conditions guaranteed literally forever, should we decide to pursue that sometime in the future.[26]
The Puget Sound BRT System in Concept [27]
Footnotes
1. 150 miles = 300 "lanes miles", ie a lane each direction for one mile. Currently 200 lane miles of the core HOV lane system are complete, and the remaining 100 lane miles have been funded.
2. This is just a guess, albeit I believe a reasonable one.
3. The role of emergency vehicle mobility is not explored in the OpEd, but it is extremely important. In every-day situations, ambulances, police cars, tow trucks and the like need to get to accidents to clear them off. Incidents and accidents cause somewhere between 30 and 50% of daily congestion on the region’s freeways (Niles 10/10/05, Hallenbeck 10/11/05). This is not to mention the necessity for emergency vehicle mobility in 911 or Hurricane Katrina type situations.
4. In the case of San Diego’s I-15 HOT lanes, the toll is varied every 6 minutes. Once a vehicle is on the HOT lane, however, the toll does not change for that vehicle.
5. What counts as a "qualified" carpool varies from HOT lane to HOT lane. On San Diego’s I-15 HOT lanes it’s HOV2 (2 or more people per vehicle). In other places it’s higher. The extreme situation, favored by most people who have spent time pondering the optimal arrangement, is that "qualified" be limited to "vanpools and better" (vanpools and emergency vehicles go free, everybody else pays) which would make management of the HOT much easier. All vehicles using the lanes would have a transponder (a gizmo about the size of a pack of cards which goes on the windshield and which tells the "reader" the identity of the vehicle). Of course if you’re in a two-person carpool, each person pays half to toll; a three person carpool, a third, etc. With "vanpools and better" the "mobility agency" will never have to "raise the bar" from HOV3 to HOV4 etc, the way it otherwise may have to. With that lower standard (eg HOV3) there is also the issue how do you tell who is cheating? There’s a car on the HOT lanes, indicating it has at least 3 people in it, but does it? How do you know? There are technological solutions (a. Make everyone "check in" with a kiosk that looks like one of those remote drive-through bank tellers; a person on a remote video would randomly check the cars. b. Every car in the HOT lanes would need to carry a cell phone capable of streaming video to do the so same kind of random check-in), but they are expensive and complicated to set up and administer. However, in the end this is obviously not just a technology question. Politics ultimately decides.
6. For instance San Diego, Houston, Minneapolis. In addition many cities are planning HOT lanes, including an extensive systems slated for the Washington DC ring freeway. Related but different are the "cordon pricing" systems in Singapore and central London, and considered for Manhattan.
7. This is a test or prototype, although if extended to the full HOV lane system some changes would be required. For instance on SR167 HOV2’s (2 person carpools) will be allowed to drive free. If extended to the full HOV lane system, the bar would need to be raised to HOV3 or higher.
8. Right turns would be permitted.
9. These would charge the same as or less than on-street parking. Inexpensive municipal lots, built to support merchants, can be found, for example, on Rodeo Drive in Beverly Hills (where the items for sale, of course, are not inexpensive).
10. Rails also allow the electronic "training" (hooking together) of buses. When in "train mode" such a system would be virtually indistinguishable to the transit patron from, eg, a rubber-tired Paris metro train. The difference is that guided-buses can go their separate ways when they reach the end of the tracks, delivering the patron directly to their destination without need of a transfer.
11. At about 12 miles, the Adelaide system, which uses German guide-wheel technology (therefore their name for this technology, "O-Bahn", which translates as "omnibus," ie bus, "rail" – which I have translated as "bus-on-rail") is the longest. The UK seems to be in the lead in terms of the most number of systems.
12. About $3,630,000,000 (2005$), per MacIsaac (8/19/05), using Sound Transit source data.
13. Having obtained federal dollars, the region has made a commitment to the federal government to complete it the Initial Segment of the light rail line between downtown Seattle and just north of SeaTac Airport. It may be, however, that the guided-bus technology could fall within the definition of "light rail" (it does run on rails) and could thus fulfill that commitment. Of course within the political realm what ultimately counts is not so much legal agreements as it is political clout. If you’ve got the votes, virtually anything is possible.
14. It is important that the various segments of a transit systems to fit together as much as possible.
Following this principle, Sound Transit is pushing for light rail on the I-90 bridge. However, according to the agency’s own numbers, while doing this and building out the rest of the first phase of the Eastside system would cost in excess of $6 Billion, it would have no effect at all on total trans-lake transit ridership! Compared to implementing Bus Rapid Transit on both bridges (SR520 and I-90) rail would simply shift riders from one bridge (520) to the other (I-90). This for $6,300,000,000?
15. See http://www.bettertransport.info/padelford/DSEIS%20ST2%201204.htm
footnotes # 17 and 18. I refer to this document as "My DSEIS Comments".
16. HOT lanes, bus tunnels and elevated bus-on-rail structures are "grade separated" and not prone to interference from cars or trucks. (It could be argued that HOT lanes are not technically grade-separated since non-transit vehicles are allowed on these lanes. However, transit and emergency vehicles always have absolute priority and other vehicles are ejected to the extent needed to keep the lanes running in free-flow. Therefore, at a minimum, they are "virtually" grade-separated.)
17. http://www.railvolution.com/workshops.html
18. Ciritiba, Brazil was a pioneer in various aspects of BRT systems, including this feature. Note that the Ciritiba system is not a guided-bus technology.
19. I don’t specifically know whether systems have been deployed with this objective, but it’s not exactly rocket science.
20. One of the main benefits of a guided-bus system is the smoothness of their ride. The Adelaide authorities claim the ride to be as good as or better than high end light rail.
21. The relative pricing of BRT/HOT vs light rail is has numerous "moving parts", not the least of which is that Sound Transit has never priced out their full, 125 mile system. And more often than not, when they have priced out a segment, costs have turned out to been lowballed to say the least. For example Sound Move, the document used to sell the light rail system to the voters, estimated a cost of $110 Million per mile (year-of-expenditure dollars) and repeatedly claimed this to be "consciously conservative." But the system is turning out to be more like a $234 Million per mile system (SeaTac to Northgate) (MacIsaac 8/19/05).
Therefore any comparison of BRT to light rail must be largely "back of the envelope." However, when the cost of one systems are an order of magnitude (10x) higher than another, an envelope may be all that’s needed. In any event, for my take on this see
My DSEIS Comments, footnotes #8 and 9, as well as Appendix B, footnote #3
22. The Right of Way (ROW) in the Downtown Seattle Transit Tunnel (DSTT) is 34.8 feet. The ROW for a guided-bus system (Adelaide) is 20.3 feet for 2-way travel.
The sidewalks in the DSTT are 14 feet.
20.3' x 2 (2 lanes each way) = 40.6'
40.6 - 34.8 = 5.8', the amount by which the existing ROW is too narrow for 4 lanes
5.8 / 2 = 2.9' or 2' 11", the amount of sidewalk that would need to be taken for 4 lanes. Call it 3'
14 – 3 = 11 feet, the width of the sidewalk remaining after 4 lanes of guided-buses put into the DSTT.
(Padelford to MacDonald 4/27/05)
(See also My DSEIS Comments, Appendix B, footnotes #12 and 13)
23. More precisely, test systems in Japan and elsewhere have demonstrated magnetic and optical guidance.
24. For another view of regional "congestion pricing" see
http://archives.seattletimes.nwsource.com/cgi-bin/texis.cgi/web/vortex/display?slug=tolls09&date=20020509
25. The HOT lanes on Highway 91 in Orange County, California carry twice the numbers of cars per lane and the adjoining general purpose lanes. However, a more typical number is 40% more (Burris, 10/4/05). Since the Puget Sound region is in the upper reaches of congestion, a number somewhere between 40% and 100% is probably the ballpark. The halfway point between those numbers is 70%. Whatever the exact number, if HOT technology were applied to all freeway lanes, they would carry a lot more cars per hour.
26. While any freeway lane will stay in free-flow forever, this does not speak to the issue of how many lanes or lane-miles should be added to the regional freeway system. For instance, it may be that I-405 should acquire an additional 2 lanes each way. Congestion pricing does not change this one way or the other, except in the sense that HOT lanes will carry more traffic during rush hours than current, general-purpose lanes (see preceding footnote) and in the sense that they will flow at 50 or 60 mph 24/7, in perpetuity.
If all freeway lanes were congestion priced several issues would arise.
> What do you do with the HOT lanes (ie the HOV lanes turned into HOT lanes), and in particular, what do you do with the HOT to HOT interchanges, which are quite expensive. Provisional answer: turn them into truck lanes. Separating truck and non-truck traffic would make the freeways considerably safer.
> What do you do with all the money raised by congestion pricing tolls? One thing you could do is use it to maintain and improve the highways. Another thing you could do is distribute it, periodically and per capita, to the voters of the region (Snohomish, King, and Pierce counties). This would work something like the annual distributions to citizens of Alaska from the Alaska Investment Fund, which was funded from North Slope oil receipts. In any event, deciding how to spend a surplus is a good problem to have.
27. Not, of course, to scale.
See also http://www.bettertransport.info/padelford/DSEIS%20ST2%201204.htm ("My DSEIS Comments") This document, which embodies my comments on a Draft Environmental Impact Statement, goes into numerous other aspects of this issue not covered here, including demonstrable bad faith on the part of Sound Transit.
Monday, November 7, 2005
Text of Initiative 912
1
INITIATIVE 912
I, Sam Reed, Secretary of State of the State of Washington and
custodian of its seal, hereby certify that, according to the records on
file in my office, the attached copy of Initiative Measure No. 912 to
the People is a true and correct copy as it was received by this
office.
AN ACT Relating to reducing the motor vehicle fuel tax rate;
1
amending RCW 82.36.025 and 46.68.090; and creating new sections.
2
BE IT ENACTED BY THE PEOPLE OF THE STATE OF WASHINGTON:
3
POLICIES AND PURPOSES
4
NEW SECTION.
Sec. 1. In 2002 voters overwhelmingly rejected a
5
nine cent per gallon increase to the motor vehicle fuel tax rate.
6
Since that time, politicians have voted to increase the motor vehicle
7
fuel tax rate by fourteen and one-half cents per gallon. This measure
8
would repeal the most recent increase to the motor vehicle fuel tax
9
rate of nine and one-half cents.
10
REPEALING THE 9 AND ONE-HALF CENT INCREASE
11
IN THE MOTOR VEHICLE FUEL TAX RATE
12
Sec. 2. RCW 82.36.025 and 2005 c ... (ESSB 6103) s 101 are each
13
amended to read as follows:
14
(1) A motor vehicle fuel tax rate of twenty-three cents per gallon
15
applies to the sale, distribution, or use of motor vehicle fuel.
16
Page 2
2
(2) Beginning July 1, 2003, an additional and cumulative motor
1
vehicle fuel tax rate of five cents per gallon applies to the sale,
2
distribution, or use of motor vehicle fuel. This subsection (2)
3
expires when the bonds issued for transportation 2003 projects are
4
retired.
5
(((3) Beginning July 1, 2005, an additional and cumulative motor
6
vehicle fuel tax rate of three cents per gallon applies to the sale,
7
distribution, or use of motor vehicle fuel.
8
(4) Beginning July 1, 2006, an additional and cumulative motor
9
vehicle fuel tax rate of three cents per gallon applies to the sale,
10
distribution, or use of motor vehicle fuel.
11
(5) Beginning July 1, 2007, an additional and cumulative motor
12
vehicle fuel tax rate of two cents per gallon applies to the sale,
13
distribution, or use of motor vehicle fuel.
14
(6) Beginning July 1, 2008, an additional and cumulative motor
15
vehicle fuel tax rate of one and one-half cents per gallon applies to
16
the sale, distribution, or use of motor vehicle fuel.))
17
Sec. 3. RCW 46.68.090 and 2005 c ... (ESSB 6103) s 103 are each
18
amended to read as follows:
19
(1) All moneys that have accrued or may accrue to the motor vehicle
20
fund from the motor vehicle fuel tax and special fuel tax shall be
21
first expended for purposes enumerated in (a) and (b) of this
22
subsection. The remaining net tax amount shall be distributed monthly
23
by the state treasurer in accordance with subsections (2) through (7)
24
of this section.
25
(a) For payment of refunds of motor vehicle fuel tax and special
26
fuel tax that has been paid and is refundable as provided by law;
27
(b) For payment of amounts to be expended pursuant to
28
appropriations for the administrative expenses of the offices of state
29
treasurer, state auditor, and the department of licensing of the state
30
of Washington in the administration of the motor vehicle fuel tax and
31
the special fuel tax, which sums shall be distributed monthly.
32
(2) All of the remaining net tax amount collected under RCW
33
82.36.025(1) and 82.38.030(1) shall be distributed as set forth in (a)
34
through (j) of this section.
35
(a) For distribution to the motor vehicle fund an amount equal to
36
44.387 percent to be expended for highway purposes of the state as
37
defined in RCW 46.68.130;
38
Page 3
3
(b) For distribution to the special category C account, hereby
1
created in the motor vehicle fund, an amount equal to 3.2609 percent to
2
be expended for special category C projects. Special category C
3
projects are category C projects that, due to high cost only, will
4
require bond financing to complete construction.
5
The following criteria, listed in order of priority, shall be used
6
in determining which special category C projects have the highest
7
priority:
8
(i) Accident experience;
9
(ii) Fatal accident experience;
10
(iii) Capacity to move people and goods safely and at reasonable
11
speeds without undue congestion; and
12
(iv) Continuity of development of the highway transportation
13
network.
14
Moneys deposited in the special category C account in the motor
15
vehicle fund may be used for payment of debt service on bonds the
16
proceeds of which are used to finance special category C projects under
17
this subsection (2)(b);
18
(c) For distribution to the Puget Sound ferry operations account in
19
the motor vehicle fund an amount equal to 2.3283 percent;
20
(d) For distribution to the Puget Sound capital construction
21
account in the motor vehicle fund an amount equal to 2.3726 percent;
22
(e) For distribution to the urban arterial trust account in the
23
motor vehicle fund an amount equal to 7.5597 percent;
24
(f) For distribution to the transportation improvement account in
25
the motor vehicle fund an amount equal to 5.6739 percent and expended
26
in accordance with RCW 47.26.086;
27
(g) For distribution to the cities and towns from the motor vehicle
28
fund an amount equal to 10.6961 percent in accordance with RCW
29
46.68.110;
30
(h) For distribution to the counties from the motor vehicle fund an
31
amount equal to 19.2287 percent: (i) Out of which there shall be
32
distributed from time to time, as directed by the department of
33
transportation, those sums as may be necessary to carry out the
34
provisions of RCW 47.56.725; and (ii) less any amounts appropriated to
35
the county road administration board to implement the provisions of RCW
36
47.56.725(4), with the balance of such county share to be distributed
37
monthly as the same accrues for distribution in accordance with RCW
38
46.68.120;
39
Page 4
4
(i) For distribution to the county arterial preservation account,
1
hereby created in the motor vehicle fund an amount equal to 1.9565
2
percent. These funds shall be distributed by the county road
3
administration board to counties in proportions corresponding to the
4
number of paved arterial lane miles in the unincorporated area of each
5
county and shall be used for improvements to sustain the structural,
6
safety, and operational integrity of county arterials. The county road
7
administration board shall adopt reasonable rules and develop policies
8
to implement this program and to assure that a pavement management
9
system is used;
10
(j) For distribution to the rural arterial trust account in the
11
motor vehicle fund an amount equal to 2.5363 percent and expended in
12
accordance with RCW 36.79.020.
13
(3) The remaining net tax amount collected under RCW 82.36.025(2)
14
and 82.38.030(2) shall be distributed to the transportation 2003
15
account (nickel account).
16
(4) The remaining net tax amount collected under RCW ((82.36.025(3)
17
and)) 82.38.030(3) shall be distributed as follows:
18
(a) 8.3333 percent shall be distributed to the incorporated cities
19
and towns of the state in accordance with RCW 46.68.110;
20
(b) 8.3333 percent shall be distributed to counties of the state in
21
accordance with RCW 46.68.120; and
22
(c) The remainder shall be distributed to the transportation
23
partnership account created in RCW 46.68.--- (section 104, chapter ...
24
(ESSB 6103), Laws of 2005).
25
(5) The remaining net tax amount collected under RCW ((82.36.025(4)
26
and)) 82.38.030(4) shall be distributed as follows:
27
(a) 8.3333 percent shall be distributed to the incorporated cities
28
and towns of the state in accordance with RCW 46.68.110;
29
(b) 8.3333 percent shall be distributed to counties of the state in
30
accordance with RCW 46.68.120; and
31
(c) The remainder shall be distributed to the transportation
32
partnership account created in RCW 46.68.--- (section 104, chapter ...
33
(ESSB 6103), Laws of 2005).
34
(6) The remaining net tax amount collected under RCW (( 82.36.025
35
(5) and (6) and)) 82.38.030 (5) and (6) shall be distributed to the
36
transportation partnership account created in RCW 46.68.--- (section
37
104, chapter ... (ESSB 6103), Laws of 2005).
38
Page 5
5
(7) Nothing in this section or in RCW 46.68.130 may be construed so
1
as to violate any terms or conditions contained in any highway
2
construction bond issues now or hereafter authorized by statute and
3
whose payment is by such statute pledged to be paid from any excise
4
taxes on motor vehicle fuel and special fuels.
5
MISCELLANEOUS
6
NEW SECTION.
Sec. 4. The provisions of this act are to be
7
liberally construed to effectuate the intent, policies, and purposes of
8
this act.
9
NEW SECTION.
Sec. 5. If any provision of this act or its
10
application to any person or circumstance is held invalid, the
11
remainder of the act or the application of the provision to other
12
persons or circumstances is not affected. If the repeal or reduction
13
of any tax in this act is judicially held to impair any contract in
14
existence as of the effective date of this act, any unused taxing
15
authority shall be repealed as of the effective date of this act and
16
the repeal of pledged revenues shall apply to any other contract,
17
including novation, renewal, or refunding (in the case of bond
18
contract).
19
NEW SECTION. Sec. 6. Part headings used in this act are not part
20
of the law.
21
--- END ---
Saturday, October 22, 2005
Left wing Activist opposes Inititiative 912
Initiative 912
This measure would repeal motor vehicle fuel tax increases of 3 cents in 2005 and 2006, 2 cents in 2007, and 1.5 cents per gallon in 2008, enacted in 2005 for transportation purposes.
I recommend a NO vote on Initiative 912.
This fall, we’ve had a lesson in infrastructure investment, or in what happens when you don’t invest in infrastructure. Hurricane Katrina overwhelmed the levees in New Orleans, resulting in catastrophe, but even Hurricane Rita exposed infrastructure difficulties. As Rita spun out in the Gulf, a Category 5 hurricane bearing down on Galveston, many Texans, mindful of what had happened with Katrina, sought to evacuate. So many, in fact, that the roads through and out of Houston were gridlocked.
The only way out for residents in the low-lying areas between Houston and the Gulf, was through roads just barely sufficient for regular, daily traffic.
Hurricanes (or typhoons, as the Pacific equivalents are called) can’t happen here; ocean temperatures are too cold, but the Pacific Northwest is not immune to natural disaster. Were an earthquake to hit Seattle, key elements of the transportation infrastructure would be at risk.
Recognizing this, the Washington state legislature passed a 9.5 cent gas tax for highway projects all across the state, but most notably to replace the Alaskan Way Viaduct and the Evergreen Point Floating Bridge.
How desperate is the situation for the Alaskan Way Viaduct? It’s an aging elevated double-decker freeway, built on fill with a deteriorating seawall. The freeway design is a similar design as the Cypress structure in Oakland, CA, which collapsed in the 1989 Loma Prieta quake. The design may have been state of the art in the 50’s, when it was built, but the 1971 San Fernando quake, as well as the Loma Prieta quake, exposed deficiencies in that design for elevated freeways. This report highlights the seismic vulnerabilities of this heavily trafficked structure, and this more recent report looks at the impact of the Nisqually quake on the viaduct.
Opponents to the gas tax collected enough signatures to place I-912 on the ballot, which seeks to overturn the gas tax. Even the gas tax opponents concede that the highway projects need to be done, but think that the money will be found elsewhere without raising taxes. The state Republican party has endorsed I-912, mixing anti-tax fervor with an evident desire to nullify Governor Gregoire’s most visible accomplishment to date. Once upon a time, Republicans actually used to invest in infrastructure; the interstate highway system was implemented under President Eisenhower, and was in part intended as a Cold War security measure.
A year ago, I was opposed to an increase in sales tax for education, despite the importance of education. I said that a sales tax was not the best way to fund education, and unless education in Washington was in a state of emergency, I couldn’t advocate paying for it with a sales tax increase. I do believe that transportation in Washington is in a state of emergency, however, and a gas tax is a fair way to pay for badly-needed transportation improvements.
Source Sherry Nichols blog
A Conservative Talk radio Host opposed Initiative 912
The conservative case against Initiative 912
By Dan Sytman
Dan Sytman is a talk-radio host in Seattle
AS a critic of Olympia's tax-and-splurge policies, I've voted for every tax-limiting initiative that has come up over the past 10 years. Upon sighting anti-tax soldier Tim Eyman at the 2004 Republican Convention, I shook his hand and giddily explained, "As a conservative from Seattle, I consider you my representative in Olympia." My thanks were from the heart.
I have publicly railed against Sound Transit, regretting its invention and urging against further expansion. I've voted against the Seattle Monorail whenever the opportunity has arisen and relish the chance to deliver the deathblow this November. So why would an anti-tax, anti-public-transportation agitator like me oppose the Holy Grail of today's local conservative movement, Initiative 912? Allow me to explain.
I voted twice for $30 license tabs because the vehicle excise is the worst kind of tax. It punishes me progressively based on the value of my car instead of how much I drive. While rightly trying to kill that obnoxious tax, the people of this state drained money from the agency that does one of the most important things government does: build roads. So when I'm asked to replace a progressive tax — the vehicle excise — with a user tax that supports the building of roads, it would be hypocritical of me to refuse.
A yes vote on I-912 is really a no vote on the very priorities conservatives like myself have been pushing all these years. We've been demanding roads, not transit. Well, now they're building roads and using one of the fairest kinds of taxes to do so — and we're going to try to stop them? Unfortunately, I think many I-912 advocates have not realized the hypocrisy of their dubious position on transportation taxes.
The 2005 transportation package — and the 9.5-cent gas-tax increase — was passed with support from about one-third of Republicans in Olympia, including highly respected conservatives like Sens. Bill Finkbeiner, Joseph Zarelli and Dan Swecker, who voted for the package because it includes projects not just for infrastructure-needy King County, but for all 39 counties. They voted for the gas tax along with an audit feature that will help enforce wise spending.
Moreover, the performance audits initiative, Initiative 900, is on track to pass this November, ensuring more accountability. Most importantly, conservative leaders in Olympia supported the gas tax because it provides almost $3 billion to address major congestion choke points and $279 million for frequent-accident locations.
I support the transportation package largely for what it does not include — lots of HOV lanes. Like most conservatives, I resist with every fiber of my being the liberal attempt to mold my behavior by forcing me into impossibly inconvenient carpools or onto buses that move as slow as molasses. You wouldn't know from listening to conservative talk radio, but in recent years the Department of Transportation has been focusing on general-purpose lanes, not HOV lanes.
That's what they're doing with the much-maligned 2003 5-cent gas tax increase, building 215 miles of general-purpose lanes and only 50 miles of HOV lanes. The controversial transportation package targeted by I-912 includes more of the same — more lanes for me to drive in and fewer HOV lanes for liberals to force me into. It builds 119 miles of new roads and only 15 miles of HOV.
While I find it hard to disagree with those who say transportation projects are bloated with prevailing-wage and environmental-mitigation laws, conservatives have lost those fights because we're outnumbered in Olympia. If we really want to address those issues, we need to figure out how to win back the Legislature and governor's mansion.
In the meantime, shutting down a bipartisan transportation package that includes accountability measures and gets to work building roads and reducing congestion would be horribly dangerous for the future of our state and damaging to the conservative cause.
If a post-I-912-era earthquake brings down the viaduct or sinks the Evergreen Point Bridge, who do you think people are going to blame? Keep in mind that the Washington State Republican Party has officially taken a position against its traditional allies in the business community by supporting I-912. It doesn't take a wild imagination to predict where the blame will fall if Washington suffers from a bridge- or viaduct-breaking catastrophe.
It's up to right-thinking voters to take a principled position on the future of transportation — and on the future of the conservative movement — by voting against Initiative 912.
Monday, August 22, 2005
Wa Policy Center argues against Initiative 912
nitiative 912 Fuels Debate Over New Gas Tax
by John Barnes, Policy Analyst
05-08
This election Washington citizens will vote on Initiative 912, a proposal to repeal the new 9.5 cent gas tax recently passed by the legislature. This Policy Note briefly describes the Initiative and summarizes the main arguments for and against it.
In April the state legislature passed and Governor Gregoire signed a bill to increase the state gas tax by 9.5 cents in four stages: raising it by three cents in July 2005 and July 2006, by two cents in July 2007, and 1.5 cents in July 2008. Initiative 912 would repeal about $5.5 billion in new gas tax revenues, leaving in place $3 billion in new revenues from higher vehicle weight taxes, higher drivers’ license fees, and other fees.
More than half of the legislature's 16-year $8.6 billion statewide transportation plan is earmarked for King County. Pierce County comes in second with an allocation of $769 million, with other counties around the state receiving various lesser amounts. Chief among the projects that would receive funding are the Alaskan Way Viaduct ($2 billion), Interstate 405 ($992 million), and the Highway 520 bridge ($500 million). These allocations only partially fund the targeted projects. Localities are expected to raise additional revenue for finishing the projects.
The new tax is the largest single gas tax increase in state history. Washington began taxing gasoline in 1924 at the rate of two cents a gallon. Today that rate is 31 cents per gallon (including the July 2005 phase-in of the recently-passed increase), giving Washington the tenth highest state gas tax in the nation. The federal government taxes gas at 18.4 cents a gallon, making the combined gas tax in Washington 49.4 cents a gallon. Under the Legislature’s plan, by 2008 Washingtonians will be paying a combined state and federal gas tax of 56 cents a gallon. The chart below shows the history of the gas tax in Washington (figure 1.1).
Not long after the new gas tax became law, opponents started a website, www.NoNewGas-Tax.com, and began the push for repeal with Initiative 912. They had no difficulty finding support for their cause. Organizers gathered more than 420,000 signatures in just over 30 days, without the use of paid signature gatherers. The groundswell of support arose in response to what many see as a misguided transportation plan with the wrong priorities.
Initiative 912 supporters say "traffic congestion won't get any better" because of the tax hike and the projects it will fund. "We need to send them [lawmakers] back to the drawing board if we are ever going to solve this problem," says one Initiative backer. Supporters' central argument is that lawmakers should not have enacted an $8.6 billion tax increase that will not relieve traffic congestion. The projects financed through the plan center around infrastructure maintenance, not capacity expansion.
Supporters of Initiative 912 are also angry that the legislature attached an emergency clause to the bill, which prevented the voters from overturning it via referendum. The number of signatures required to put a referendum on the ballot is half the number required for an initiative. This move, many argue, reflects lawmakers' distrust of their own constituency.
Initiative 912 opponents have started their own website, www.KeepWashingtonRolling.com. Several of Washington's largest companies, labor unions and trade associations have thrown their weight behind the effort to defeat Initiative 912. The new tax, they say, is a small price to pay for the increased safety that will come from the more than 200 road projects the new tax would fund, projects such as highway and bridge upgrades for earthquake safety. Congestion relief would have to come above and beyond all of that, and at additional cost. Initiative 912's opponents also argue that these projects will create thousands of new jobs over the next several years, although this assumption does not account for jobs lost due to the higher tax.
While Initiative 912 supporters say the Department of Transportation needs to do a better job of managing the funds it already has, Keep Washington Rolling points out that the gas tax bill includes measures to do just that. To obtain key Republican support for the tax increase bill, lawmakers appropriated $4 million to the state auditor to conduct independent performance audits of the Department of Transportation. Even if Initiative 912 passes, the performance audit provisions would remain in place.
Keep Washington Rolling says the average Washington driver will pay only 41 cents more per week under the new tax increase ("average" in this case means driving 12,070 miles per year in a car that gets 17 miles per gallon). Opponents of the tax increase counter the math by pointing out that when such incremental arguments are used every time the government wants to raise taxes, a little bit here and a little bit there adds up to a significantly larger tax burden in the long run.
Revenue from the state gas tax has increased over the years, as shown in the chart below (figure 1.2).
Gas tax collections increased five percent above inflation between 1995 and 2004. Two factors have contributed to this trend. The state tax rate has gone from two cents per gallon in 1924 to 31 cents today—an increase of more than 1,500%. Additionally, state residents now consume three times as much gasoline as they did in 1960, and the number of vehicle-miles-traveled has doubled since 1980. While a gallon is the same size today as it was in 1924, the fiscal reality is that there are many more vehicles on the road driving more miles, thereby generating more revenue for state coffers.
If Initiative 912 passes in November, it will be the second time in three years citizens voted down a large gas tax increase. In 2002 voters overwhelmingly defeated Referendum 51, which would have raised the tax by nine cents per gallon. Responding to the anti-tax sentiment that killed Referendum 51, the legislature in 2003 approved a lower increase of five cents a gallon.
Off-year elections tend to produce lower voter turnout due to the paucity of measures and candidates on the ballot, but 2005 could very well buck that trend. If the grassroots support behind Initiative 912 and the scale of organizations opposing the measure are any indication, the Initiative is sure to draw large numbers of voters to the polls in November.
For more information, see the Transportation chapter of Agenda 2005: The Guide to Public Policy Issues in Washington State at www.Agenda2005.org.