April 2008
The Facts on Light Rail
A comparative analysis of light rail systems in six West Coast cities
by Michael Ennis
Director, Center for Transportation
Key Findings
As Washington cities consider whether light rail is right for them, this study on
the performance of the six existing systems on the West Coast provides factual, real life
examples of what taxpayers could expect here. Policymakers and the public should
consider whether diverting transportation taxes away from other programs and services
is worth the opportunity costs. Based on the data, this analysis concludes that it is not.
Often, public agencies try to estimate, with little success, how such a system in
Washington would perform. Through unrealistic modeling and ambitious assumptions,
they typically underestimate operating and capital costs, and overestimate revenue and passenger demand.
This is especially true with light rail systems.
For example, in 1996, Sound Transit officials in the Seattle area promised its first light rail segment would be completed by 2006 and would cost about $5 billion.1 Today, Sound Transit says the total cost is about $15 billion and the segment will not be
finished until around 2020.2
Analyzing the performance of existing light rail systems sidesteps these guesses and offers a factual picture.
There are six light rail systems on the West Coast that have been operating since
at least 1995: Los Angeles, Portland, Sacramento, San Jose, San Diego and San Francisco.
This study looks at their past performance and results in the following key findings:
• Light rail systems on the West Coast served only about 2% of the
workforce in the service areas of the six systems.
• On average, these systems only remove between 0.39% and 1.1% of
cars from the roadway.
• On average, West Coast light rail systems require taxpayer subsidies to
pay for 73% of operations and 100% of capital improvements per year.
• The average cost to add one additional rider to the light rail systems on
the West Coast is between $82,285 and $242,014 per rider.
• Attracting a new rider to light rail costs 16 to 47 times as much as
attracting a new rider to a traditional bus system.
1 Sound Move, The 10‐Year Regional Transit System Plan, May 1996. 2 Sound Transit, University Link Financial Plan, June 2006.
Washington Policy Center 2
• When accounting for passenger demand, light rail on the West Coast is
12% more expensive to operate than bus service.
• In the ten years between 1996 and 2005, the public subsidy (operating
costs only) for all light rail systems in the U.S. grew from $250 million to
$729 million. An increase of 191%.
• The relationship between light rail and any environmental or economic
development advantages is so slight that their use on influencing policy
decisions should be proportionally minor.
Examining the six existing light rail systems in major West Coast cities helps residents in the Puget Sound, Vancouver and Spokane understand what they could expect from spending on similar systems in Washington.
The most relatively efficient systems on the West Coast are San Francisco and
Portland. They move the most people for the least cost and beat the six‐city average in
most cases.
By a large margin, the worst‐performing system is San Jose. In every category, its performance is worse than the six‐city average.
Regardless of how each system ranks with another, the overall poor
performance of all six light rail systems on the West Coast shows that there is a very large gap between public costs and public benefits.
Even the best‐performing systems require a large taxpayer subsidy and have little or no affect on reducing traffic congestion. And on average, light rail is more expensive to operate than a normal bus service.
Policymakers and the public should consider whether diverting transportation
taxes away from other programs and services is worth the opportunity costs. Based on the data, this analysis concludes that it is not. There must be a stronger relationship
between public spending and congestion relief. Spending significant amounts of
transportation tax revenue on projects that have no influence on reducing congestion inevitably makes traffic worse.
Washington Policy Center 3
Introduction
As congestion continues to grow in major cities across the United States,
policymakers are looking toward light rail transit as a possible solution. In 1980, there were only nine light rail systems in the U.S.; today, there are twenty‐nine.3
In Washington, Puget Sound voters in 1996 approved the region’s first light rail segment by authorizing Sound Transit to build a line between the airport and North of Seattle. Last November, regional voters rejected Sound Transit’s proposed second
phase, which would have added another 40‐50 miles of light rail. Sound Transit officials are already planning to go to voters with a second measure.
In Clark County, public officials are considering a light rail system across a new
Columbia River bridge to Portland. And while Spokane voters recently rejected
continuing to look at light rail, officials there may yet try again to fund a system.
This study compares the performance of the six major West Coast cities
operating light rail since 1995. The cities are Los Angeles, Portland, Sacramento, San
Jose, San Diego and San Francisco. The following table summarizes key background data (2004) on each system.4
Six major cities on the West Coast with light rail, 2004 data
System Individual
Length, Light Rail Riders per Annual Operating Annual Farebox
in Miles Vehicles day5 Cost Revenue
Los Angeles 116.3 121 40,503 $111,654,300 $18,899,600
Portland 92.9 105 38,856 $56,965,800 $19,822,200
Sacramento 62.6 72 13,589 $35,225,800 $7,853,400
San Diego 97 123 32,718 $41,830,500 $24,196,900
San Francisco 72.9 181 55,710 $105,899,500 $21,473,700
San Jose 71.5 80 6,748 $45,752,500 $4,367,700
Source: National Transit Database
3 Bureau of Transportation Statistics, Available at
http://www.bts.gov/publications/national_transportation_statistics/html/table_transit_profile.html
4 Data adapted from the American Public Transportation Association (APTA), Rail Statistics. Available at:
http://www.apta.com/research/stats/rail/index.cfm
5 Light rail ridership is typically measured in unlinked trips. The American Public Transportation Association defines unlinked trips as “the number of passengers who board public transportation vehicles. Passengers are counted each time they board vehicles no matter how many vehicles they use to travel from their origin to their destination.” Unlinked trips can double or triple count the same rider. In order to translate unlinked trips into individual daily riders, this report uses a conversion factor of 45%.
Washington Policy Center 4
Spending transportation taxes on light rail instead of traffic relief is a
controversial decision. Light rail opponents often argue it is too expensive for such little benefit, while supporters like its reliability and speed.
Based on its rapid growth across the country, light rail supporters are clearly
winning the public debate. Today, there are nearly 1,400 miles of light rail track in cities across the country with another 190 miles under construction.6
But analyzing the performance data of existing systems shows that light rail is not providing the benefits supporters so eagerly claim.
In a recent study by the Brookings Institution, On the Social Desirability of Urban
Rail Transit Systems, authors Clifford Winston and Vikram Maheshri argue that every
public transit rail system (25 at the time of the study) had a negative impact on social
welfare; meaning the average value of the service was less than the average cost to
society.7
Annual Net Social Cost of Rail to
Six Major West Coast Cities
Los Angeles $125 million
Portland $221 million
Sacramento $106 million
San Diego $29 million
San Francisco $250 million
San Jose $211 million
Winston and Maheshri show the annual
monetary social cost of rail to the host city. The
adjacent table shows these costs to the six major
West Coast cities that have had light rail since 1995.
As the authors point out, these negative impacts occur for two reasons: high costs (capital and operating) and low passenger demand.
As with any public transit system, passenger fares only recover a minor percentage of the total operating costs and no capital expenditures. In
1995, the public subsidy (operating costs only) for all light rail systems in the U.S. was
$250 million. In 2005, public assistance grew by 191%, to $729 million.8 Combining both capital and operating costs, the public subsidy for light rail in 1995 was $938 million. In 2005, the subsidy grew to $3.2 billion.9
As with most public services, taxpayers will tolerate high costs as long as they think their purchase results in a proportional benefit. Winston and Maheshri show that rail transit fails to produce this return on investment. And comparing the performance of the six systems on the West Coast indicates they are right.
6 APTA, 2007 Public Transportation Fact Book. Available at
http://www.apta.com/research/stats/factbook/documents/section_19_rail_pages_63_to_79.pdf.
7 C. Winston, V. Maheshri, On the social desirability of urban rail transit systems, Journal of Urban Economics, 2006.
8 APTA, 2007 Public Transportation Fact Book. Available at
http://www.apta.com/research/stats/factbook/documents/section_19_rail_pages_63_to_79.pdf.
9 Ibid.
Washington Policy Center 5
Light Rail Demand is Low
Ridership is generally the best factor for measuring the success of any transit
service, and light rail is no different. If passenger demand is high enough, then the space between cost and benefits is small. Likewise, if passenger demand is low, then the space between cost and benefits is high.
Consider the following table that compares the combined working populations of the six major west coast cities with their respective light rail passenger demand in 1995, 2000 and 2005.
Combined Daily Light Rail Ridership: Los Angeles,
Sacramento, San Diego, San Francisco, San Jose & Portland
12,000,000
1.06% 1.69% 1.97%
10,000,000
8,000,000
6,000,000
4,000,000
2,000,000
0
1995 2000 2005
Combined Daily Light Rail
Ridership
Combined Working Population
The combined regional working population of the six West Coast cities that have light rail was about 10.7 million people in 2005.10 The number of daily riders using light rail in the same cities in 2005 was about 206,694 per day.11 This means only 1.97% of all workers within those cities choose to use light rail in any given day.
10 Population data adapted from the Federal Highway Administration. Available at: http://www.fhwa.dot.gov/ctpp/jtw/jtw8.htm.
11 Light rail ridership is typically measured in unlinked trips. The American Public Transportation Association defines unlinked trips as “the number of passengers who board public transportation vehicles. Passengers are counted each time they board vehicles no matter how many vehicles they use to travel from their origin to their destination.” Unlinked trips can double or triple count the same rider. In order to translate unlinked trips into individual daily riders, this report uses a conversion factor of 45%.
Washington Policy Center 6
Light Rail Does Not Reduce Congestion
For transit to appreciably reduce traffic congestion, it must shift a large number of drivers from the roadways to its system.
It is unlikely the 206,694 daily riders on West Coast light rail systems in 2005 translate to an equal number of cars that would otherwise be on the roadway. Most light rail riders come from the existing bus systems.
For example, Sound Transit officials in Seattle estimated that nearly two‐thirds of its ridership would have come from the existing transit system if its second phase had been approved in 2007.12
206,694 cars are not insignificant but there are about 18 million vehicles in the six regions studied.13 Assuming two‐thirds of passenger demand draws from existing public transit, the light rail systems on the West Coast shift a miniscule 0.39% of cars off the roadway. Assuming every rider translates to one vehicle, then light rail still only
removes 1.1% of cars from the roadway.
In either case, passenger ridership on light rail is not nearly great enough to
reduce traffic congestion. In fact, it can be argued that diverting such a large proportion of transportation tax revenue to light rail takes money away from and weakens
programs that actually reduce congestion.
Per‐Rider Cost is High
Accounting for passenger demand shows the eye‐popping cost required to add one additional rider to a light rail system on the West Coast.
Combined ridership in 1995 was 107,751 people per day for all six systems. Over
the next ten years, the six cities spent about $8.1 billion in capital and operating
expenses to serve an additional 98,943 people per day.14 So the capital cost to add one
additional rider to the system between 1996 and 2005 was $82,284 per person.
Again, assuming two thirds of those riders came from existing bus transit means the capital cost to add one additional new transit rider was $242,015 per person.
12 Gregory Roberts, Prop 1. no cure for commute, Seattle Post Intelligencer, 2007. Available online at:
http://seattlepi.nwsource.com/transportation/336095_worth19.html
13 http://www.fhwa.dot.gov/ctpp/jtw/jtw8.htm
14 Data adapted from the federal government’s National Transit Database. Available at:
http://www.ntdprogram.gov/ntdprogram/data.htm.
Washington Policy Center 7
To put this in perspective, King County (Seattle) recently passed Transit Now, which will expand its bus system by 20%.
King County officials estimate Transit Now will add up to 27,000 new daily riders to the county’s transit system. Adjusting for inflation, the cost of Transit Now will be about $140 million per year. This means the total cost for King County to add one new rider to its system will be about $5,185 per person.15
This means attracting a new rider to light rail costs 16 to 47 times as much as attracting a new rider to a traditional bus system.
Weighing these costs and benefits shows that light rail is extremely inefficient, even when compared to other public transportation alternatives. To look at it another way, consider the following chart, which compares the total cost per trip between light rail and traditional bus service on the same six agencies on the West Coast.
Operating Cost Per Trip (2005): Bus & Light Rail.
Los Angeles, Sacramento, San Diego, San Francisco,
San Jose, Portland
$3.00
$2.62
$2.50
$2.00
$1.50
$1.00
$0.50
$0.00
Light Rail: Operating Cost Per Trip
$2.34
1
Bus: Operating Cost Per Trip
The total annual operating costs (not including capital) for the six light rail
systems on the West Coast was about $439 million in 2005.16 The total trips for the
15 Part V: The Imbalance of Roads and Transit, 2007. Washington Policy Center. Available at:
http://www.washingtonpolicy.org/Transportation/PN_partvimbalance.html.
16 Data adapted from the federal government’s National Transit Database. Available at:
http://www.ntdprogram.gov/ntdprogram/data.htm.
Washington Policy Center 8
same systems in 2005 were 167.6 million.17 This means the operating cost for the six light rail systems on the West Coast was $2.62 per trip.
The total operating costs for traditional bus service in the same six agencies was about $1.5 billion and annual trips were about 642 million.18 The operating cost for traditional bus service in 2005 was about $2.34 per trip.
When accounting for passenger demand, light rail on the West Coast costs 12% more to operate than traditional bus service.
This is important because light rail supporters will say that after the initial capital spending, light rail is cheaper to operate than other modes of public transit. On average and among the six western cities with light rail, this is not true.
Other Benefits of Light Rail Lack Evidence
Backers also claim that light rail has certain environmental and economic
development benefits that help justify costs. But there is little evidence to support these
claims.
For example, Portland officials say that the Max light rail system has brought more than $6 billion in new development since the decision for light rail was made in 1978.19 But through zoning changes, tax breaks, outright grants and selling publicly owned property at below market rates, the city was able to attract development along the rail line or near the stations.20 More than light rail, the large public subsidies were likely the main reason for the new development.
The commercial growth claim also fails to account for potential development
that would have naturally occurred in other areas. The Brookings Institution’s Winston and Maheshri say,
“Case studies have yet to show that after their construction transit systems have had a significant effect on employment or land use close to stations and that such benefits greatly exceed the benefits from commercial development that would have occurred elsewhere in the absence of rail construction.”21
17 Ibid.
18 Ibid.
19 http://trimet.org/about/history/maxoverview.htm.
20 Randal O’Toole, Debunking Portland, CATO, 2007. Available online at: http://www.cato.org/pubs/pas/pa‐596.pdf.
21 C. Winston, V. Maheshri, On the social desirability of urban rail transit systems, Journal of Urban Economics, 2006.
Washington Policy Center 9
Because of these alternative and perhaps more influential variables, it is difficult to casually conclude that a light rail system stimulates economic development; light rail is not as impactful for economic development as public agencies try to claim.
Furthermore, because ridership is so low, the environmental benefits of light rail over the same riders using higher emission buses or passenger cars are easily erased with slight improvements in efficiency and alternative fuels.22 Likewise, light rail
construction and expansion also tempers any environmental advantages due to its long construction period and high energy consumption.
The relationship between light rail and any environmental or economic
development advantages is so slight that their use on influencing policy decisions should be proportionally minor.
Conclusion
Examining the six existing light rail systems in major West Coast cities helps
residents in the Puget Sound, Vancouver and Spokane understand what they can expect from spending on similar systems in Washington.
The following table illustrates the combined mean, high and low results of several key performance data in the six West Coast cities with light rail.
Key performance of six West Coast cities with light rail, 2004 data
Annual
Daily Public Annual Public Operating
Individual Riders Per Mode Share as Subsidy, Subsidy, Cost Per Operating
Riders Track a Percent of Operating Operating & Rider, Light Cost Per
Per Day Mile Workers Costs Capital Costs Rail Rider, Bus
Los Angeles 40,503 348 1.08% 83% 91% $2,757 $1,759
Portland 38,856 418 3.23% 65% 89% $907 $2,258
Sacramento 13,589 217 1.61% 78% 86% $3,078 $3,109
San Diego 32,718 337 2.47% 42% 89% $3,237 $2,398
San Jose 6,748 94 Included in SF 90% 97% $6,781 $4,490
San Francisco 55,710 764 1.77% 80% 91% $1,023 $1,542
Average 31,354 363 2.03% 73% 91% $2,964 $2,593
Source: National Transit Database
22 Todd Myers, Light Rail on I‐90 Will Do Little to Reduce CO2, Washington Policy Center, 2007. Available online at:
http://www.washingtonpolicy.org/Centers/environment/PolicyBrief/07_light_rail.html.
Washington Policy Center 10
The most relatively efficient systems on the West Coast are San Francisco and
Portland. They move the most people for the least cost and beat the six‐city average in
most cases.
By a large margin, the worst performing system is San Jose. In every category, its performance is worse than the six‐city average.
Further study should be conducted to gain a better understanding on why San
Francisco, Portland and San Jose appear so far from the average of the other systems.
Regardless of how each system ranks with another, the overall poor
performance of the six light rail systems on the West Coast shows that there is a very large gap between public costs and public benefits.
Even the best‐performing systems require a large taxpayer subsidy and have little or no affect on reducing congestion. On average, light rail is more expensive to operate than a normal bus service.
Policymakers and the public should consider whether diverting transportation taxes away from other programs and services is worth the opportunity costs. Based on the data, this analysis concludes that it is not.
There must be a stronger relationship between public spending and traffic congestion relief. Spending transportation tax revenue on projects that have no influence on reducing congestion inevitably makes traffic worse.
Transportation
Monday, April 14, 2008
Light Rail: comparing six West coast cities


Wednesday, March 29, 2006
The Case for More Road Capacity
Seattle's Congestion Future Is Bleak Without More Road Capacity
We can build our way out of this mess
By David T. Hartgen and Robert W. Poole, Jr.
3/29/06
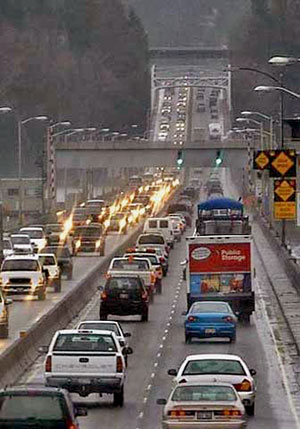
When it comes to traffic jams, the Seattle-Tacoma area is the most congested in the Northwest, just ahead of much-smaller Portland, and ranks 12th nationwide. The area has a congestion index of 1.38, meaning that trips at rush hour take 38 percent longer than off-peak journeys. But if you think that's bad, just wait until 2030.
Over the next 25 years, after absorbing almost 1 million more residents and even more car and truck trips, that same rush-hour trip will take 79 percent longer than a trip made at off-peak times, making Seattle's congestion even worse than the gridlock experienced in Los Angeles today. A trip in Seattle that is supposed to take 30 minutes, will take over 52.
And by 2030, Seattle will have jumped up to the 8th worst commute in the nation.
This forecast comes from our new Reason Foundation study and assumes that all transportation projects in the region's current 25-year plan are actually implemented. The Seattle transportation plan proposes to spend $102 billion over 25 years, including $46 billion for transit and $49 billion for highway projects.
Many motorists or taxpayers might well be asking: do you mean that we are going to spend $102 billion over the next 25 years, and our congestion will be significantly worse after all the spending? Sad to say, the answer is yes.
That's because local transportation planners have bought the idea that we can't build our way out of congestion, so it's hopeless to try. In keeping with recent trends around the country they focused more on reducing driving, proposing mass transit systems and high-density housing projects intended to get people out of their cars. They know that the demand for highway travel will be greater than the supply, but instead of increasing road space in response to what people want they hope to reduce the demand instead to fit within the limited available road space.
This is the approach California tried for 20 years. In the 1980's California stopped building freeways and poured billions of dollars into rail transit systems in Los Angeles, San Francisco, San Jose and San Diego. Unfortunately, the planners couldn't close the door: people kept moving to California and they brought their cars with them. Transit use and carpooling today handle a smaller fraction of trips than they did 20 years ago. The result is that Los Angeles and San Francisco top the national charts in congestion. Other cities that have lately tried the California model have seen their congestion soar, as well. Seattle is one of them.
But the tide may be turning. To its credit, Seattle is among a handful of cities that have gingerly begun to investigate the costs and benefits of expanded highway capacity. And our new research suggests that adding highway capacity is the most important part of an effective effort to reduce traffic congestion.
Our study modeled the hypothetical addition of enough capacity in every U.S. metro area to eliminate the worst congestion by 2030. Seattle was one of the participating cities in that analysis. We found the Seattle region would require adding 704 lane-miles to the existing highway system over the next 25 years, on freeways, arterials, and local roadways. We estimate the cost of that as $4.8 billion in today's dollars. That amounts to a bit under $34 per resident per year, but is less than a tenth of what Seattle plans to spend anyway. So, just by re-focusing its present spending, Seattle could actually reduce congestion if it chose to do so. That investment would save 200 million hours of delay per year that would otherwise be spent stuck in traffic, and the cost, just 96 cents per hour of delay saved – and that is 1/ 20th the minimum cost for light rail proposals.
Where would the new capacity go? While our study did not get into this level of detail, one of most likely possibilities is to add a complete network of HOT or express toll lanes to the existing freeway system. Another possibility is adding truck-only toll lanes in selected corridors, as Atlanta and Los Angeles are now planning to do. Many major thoroughfares that serve growing suburbs should also be widened to handle the traffic that we know is coming.
The Seattle region is at a crossroads in transportation planning. Pulling one way are those who favor the California model: try to get people out of their cars by diverting transportation funds away from highways and into transit and land-use densification. On the other side are harried commuters just trying to cope. In reality, there is no realistic alternative to highways for personal mobility, goods movement, and bus transit, so we need to keep growing the highway system in step with demand for vehicular travel. Cities like Atlanta and Houston – and now Seattle - are beginning to re-think their planning to focus more on congestion relief, and we applaud this trend.
The Seattle region is in competition with other cities as a place to live, do business and play. Seattle's ace cards are its great environment and easy access to the world stage. But these will not be enough. A key factor in people and companies' location choices is mobility: does the transportation system permit smooth and reliable commuting, goods movement and personal trips for recreation and tourism? Those metro areas that can offer such mobility will break out of the pack, ahead of those whose systems are increasingly gridlocked.
Which future do you want for Seattle?