3/8/06 Transportation system congestion is one of the single largest threats to our nation's economic prosperity and way of life. Whether it takes the form of cars and trucks stalled in traffic, cargo stuck at overwhelmed seaports, or airplanes circling over crowded airports, congestion costs America an estimated $200 billion a year. In 2003, Americans lost 3.7 billion hours and 2.3 billion gallons of fuel sitting in traffic jams and wasted $9.4 billion as a result of airline delays. Congestion is also affecting the quality of life in America by robbing us of time that could be spent with families and friends and in participation in civic activities. The Bush Administration does not believe that this is an inevitable fate. The National Strategy to Reduce Congestion on America's Transportation Network (the "Congestion Initiative") is premised on the fact that there exist innovative and demonstrated strategies that more efficiently and effectively provide relief to traffic gridlock than current practice. These options include technologies such as congestion pricing and high-speed open road tolling, and the billions of dollars in private capital available for investment in public infrastructure. In 2006, the U.S. Department of Transportation, led first by Secretary Norman Mineta and then Secretary Mary Peters, announced a major initiative to reduce transportation system congestion. This plan provides a blueprint for Federal, State, and local officials to consider as we work together to reverse the alarming trends of congestion. It includes several major components: (1) Congestion Relief Programs; (2) Public Private Partnerships; (3) Corridors of the Future; (4) Implementing Technological and Operational Improvements; and (5) Increasing Aviation Capacity. The root causes of congestion have long been understood, and there is now broad consensus that congestion generally reflects a fundamental imbalance of supply and demand. That is, during hours of peak usage of the transportation facilities most desirable to motorists, the supply of, for example, roadway capacity is insufficient to meet the demand for those facilities. Economists have long understood that such an imbalance stems from inefficient pricing, where the true costs of usage are not reflected in prices paid by the users. For example, travelers are not generally charged for the impact their trip will have on others using the same facility (e.g., increased levels of congestion) or on other members of society (e.g., increased air pollution). In fact, in this country, access to highway travel is, for the most part, rationed by delay. Congestion pricing can provide the balance uch as employee telecommuting options or making transit easier and more attractive to use. Also of interest in managing demand are driver incentive programs that, for example, promote ridesharing and off-peak use. Strategically Invest in New Transportation Capacity. Although there is significant and widespread demand for new highway capacity, concerns about air pollution, noise, and urban sprawl often stand in the way of expanding the system. Equally significant, adding new capacity can be enormously expensive and physically challenging. Despite the barriers, however, new construction that serves critical strategic purposes will go forward in order to preserve or improve system performance. Although widespread capacity increases are a thing of the past, many of the barriers may be addressed through increased expenditures. Environmental concerns may be mitigated and physical challenges overcome (for example, through tunneling). However, the resources to fund such improvements simply are not available through traditional sources. For this reason, many professionals in the transportation community are enthusiastic about the opportunities potentially afforded by public-private partnerships and road pricing.Overview
Causes and Solutions
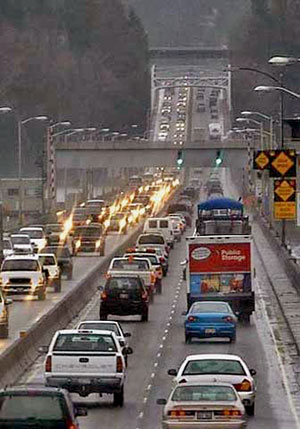
between supply and demand that allows
traffic to flow more smoothly, avoiding scenes
of congested traffic like this one.
The imbalance of supply and demand leading to congestion is also impacted by the absolute volume of traffic (e.g., demand) on a given facility relative to its physical capacity (e.g., supply). When we look at traffic congestion from a demand perspective, we are looking at how many vehicles compete for space on a particular facility at a given time. The demand for a facility is a function of individual decisions as to when, where, how, and even if highway travel will take place.
On the supply side, congestion is a function of physical constraints and how the driver interacts with a given facility as well as with other vehicles on the facility. On-the-road congestion is characterized as either recurring (routine) or nonrecurring (random). Recurring congestion happens in roughly the same time and place on the same days of the week. It results when physical capacity is simply not adequate to accommodate short-term demand during peak periods. Recurring congestion may also result from improperly timed traffic signals. As indicated in Figure 1, recurring congestion accounts for close to half of total delay. On the other hand, nonrecurring congestion is caused by transitory events such as construction work zones, traffic incidents, and bad weather. The significance of nonrecurring congestion is that it can temporarily prevent full utilization of the existing physical capacity.
Figure 1. Congestion experienced by highway travelers is caused by many different factors.
Consistent with the paradigm of its causes, there are four distinct, but nonetheless related strategies available to attack congestion. It is important to note that the strategies, while individually of merit, work best when implemented as a coordinated package of tools.
Bring Supply and Demand into Alignment through Congestion Pricing. Congestion pricing or peak-period pricing, entails fees or tolls for road use that vary by level of vehicle demand on the facility. As with market pricing in other sectors, road pricing helps allocate limited supply - in this case that of available road space.
With user charges assessed at the point of use, greater efficiency results through improved response to market forces. Charges are typically assessed electronically to eliminate delays associated with manual toll collection facilities. Road-use charges that vary with the level of vehicle demand provide incentives to shift some trips to off-peak times, less-congested routes, or alternative modes; or to cause some lower-value trips to be combined with other trips or simply to be eliminated.
Congestion pricing has several important objectives. First, it seeks to balance demand with available capacity, i.e., the supply of road space. Second, it seeks to fairly allocate the costs associated with operating, maintaining, and expanding the transportation system to meet growing travel demand. Third, it seeks to improve operation of the highway system. A fourth objective may include revenue generation.
Provide Better Choices as to How, When, Where, and If to Travel. The goal with this strategy is to reduce the number of vehicles on a given road. This may take the form of promoting alternative commute options s
Effective and efficient management and operation of the system is foundational to all of the above congestion reduction strategies. This is true because as traffic volumes have grown over time and physical capacity has remained relatively constant, the system has become less able to absorb "surprise" - or nonrecurring events. In the realm of managing the highway system, the margin for error is very small and continues to decline. In addition, operational fixes to the system are also helpful in addressing the recurring congestion resulting from bottlenecks and improper traffic signal timing.
To combat the country's growing transportation congestion problem, the U.S. Department of Transportation launched the National Strategy to Reduce Congestion to America's Transportation Network. Not surprisingly, one element of this initiative is focused on applying 21st century tools to manage and operate the system at peak efficiency.
>2 U.S. DOT Congestion Initiative:
" >Operations & Technology
Why is my route to work always congested, and why isn't more being done to reduce congestion?
The U.S. Department of Transportation's Strategy to Reduce Congestion focuses on the answer to this question. While the root causes of traffic congestion have long been understood, there is now broad consensus that congestion generally reflects a fundamental imbalance of supply and demand. The core principle of the Department's Congestion Initiative is that we can bring transportation system supply and demand into alignment through congestion pricing, which is detailed in the Relieve Urban Congestion point of the initiative (one of six points). The Operational and Technological Improvements point of the Congestion Initiative focuses on the supply side - how we can better manage and operate the transportation system (supply) to relieve congestion.
Recurring congestion (non-optimized supply not meeting user demand) experienced by drivers on the road today is caused by physical bottlenecks and poor traffic signal timing. Other congestion events are caused by non-recurring factors, such as crashes and other incidents, highway construction, and bad weather. The goal of this point of the Congestion Initiative is to have transportation system managers manage these recurring and nonrecurring conditions successfully (in conjunction with a congestion pricing approach to balancing supply and demand) so that the system is optimized and more efficient. For more information on how Operational and Technological solutions fit into the overall congestion problem, read about the Congestion Problem and its Causes and Solutions.
The operational and technological solutions presented in this point of the Congestion Initiative include providing traveler information, improving traffic incident management, enhancing mobility in the vicinity of work zones, improving traffic signal timing, and reliving traffic congestion at bottlenecks (see Key Focus Areas box at the top right of this page or Figure 1, an interactive diagram visually showing how some of the elements in this point of the Congestion Initiative fit together, for links to the focus areas). Collectively, these practices provide operators, planners, decision makers, and travelers with information that allows for more informed decisions, better coordination, and quicker actions that can help avoid and reduce traffic congestion.
The Federal Highway Administration and State and local transportation officials are building on early successes with these focus areas and are demonstrating the potential for significant benefits to national mobility, with the ultimate goal of deploying these technologies and practices broadly across the country.
Operations & Technology Home
3 Traffic Incident Management
Good Practice Examples
Atlanta, GeorgiaSan Antonio, Texas
>Florida
>You're driving in rush hour traffic, traffic is heavy, but it's still moving. Then, all of a sudden, traffic comes to a stand still. You wonder why. When you finally make it to the "problem" it seems to be nothing more than a flat tire. Often, there will be no apparent reason for the slowness and traffic returns to its normal speed. What happened? Why did such a small event cause such a big problem?Lane-blocking incidents affect traffic flow far out of proportion to the number of lanes blocked. An incident blocking one lane out of three on a freeway reduces the capacity of that facility by approximately 50 percent. Blocking two lanes of three reduces capacity by nearly 80 percent.
If a lane is blocked when traffic flow is at or near the capacity of a facility the queue of traffic that accumulates behind the incident will not dissipate after the incident is removed until the traffic flow into the queue decreases - in other words until the peak period ends. Thus a standing queue of traffic may exist for several hours, even after the incident is removed, depending on when the incident occurred, how many lanes were blocked, and how long the blockage lasted. In general, each minute of lane blockage creates 4 minutes of congestion after the incident is cleared.
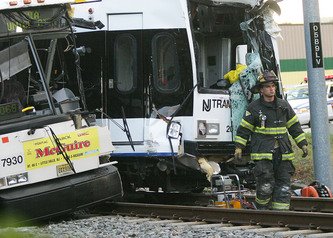
The safety of responders, such as the law enforcement, fire, and emergency medical services personnel shown here, continues to be of utmost importance under Federal and State initiatives on incident clearance.
Not surprisingly, of all the reasons for traffic congestion, traffic incidents cause approximately 25 percent of total delay. For this reason the Federal Highway Administration (FHWA) has in place a robust Traffic Incident Management (TIM) program to assist State and locals transportation agencies in reducing the time it takes to restore capacity following a traffic incident. TIM is a planned and coordinated process to detect, respond to, and remove traffic incidents and restore capacity as safely and quickly as possible. Quick clearance of traffic incidents also reduces the likelihood of secondary incidents such as crashes, or stalls from overheating or running out of gas. Quick and coordinated clearance also increases safety for travelers and incident responders. Promoting more aggressive and widespread traffic incident management is an important strategy to lessen the effects of nonrecurring congestion as well as provide a safer driving environment.
Under the banner of the USDOT Congestion Initiative FHWA signaled out TIM four strategies for particularly intense focus:
Full-Function Service Patrols
Driver Removal ("Move It") Laws
Safe, Quick Clearance Policy Agreements
Integrated Communications for Transportation and Public Safety Agencies
These strategies complement the recently ratified National Unified Goal (NUG) for Traffic Incident Management. The NUG, developed through the efforts of the National Traffic Incident Management Coalition (NTIMC), is intended to improve safety for incident response personnel and facilitate clearing incidents as quickly as possible. The NTMIC includes 20 national transportation, public safety, and private sector associations working together to improve traffic incident management in the United States.
4 Traffic Signal Timing
Good Practice Examples
ACS-Lite
Texas, California, and Florida - Upgrading Systems
Puget Sound Washington
Every morning on your way to work, you pass through the same series of intersections. And, every morning you are stopped by a red traffic signal for no apparent reason; where you sit in a very long line of cars. The green signals never seem to be long enough, and once you make it through the intersection you are soon stopped by another red traffic signal. It is a tremendous source of irritation! The signals change colors but traffic never seems to move efficiently. You may be the victim of poor traffic signal timing and this scenario is repeated daily all around the country.
Updating traffic signal timing is a cost effective way to improve the flow of traffic on arterials and is one of the most basic strategies to help mitigate congestion. Of the estimated 330,000 traffic signals in the United States, and as many as 75 percent could be made to operate more efficiently by adjusting their timing plans, coordinating adjacent signals, or updating equipment. In fact, optimizing signal timing is considered a low-cost approach to reducing congestion, estimated at $2,500 to $3,100 per intersection to update. Optimizing traffic signal timing can produce benefit to cost ratios as high as 40 to 1. Those benefits include:
An image showing vehicles traveling through multiple traffic signals along a busy roadway.
- Shorter commute times
- Improved air quality
- Better fuel efficiency, and
- Decreased driver frustration
It is estimated that poor traffic signal accounts for 5 percent of all supply-side traffic delay on major roadways. The U.S. DOT is working with the State and local transportation agencies to improve the management, operation and maintenance of traffic signal systems. The FHWA sponsored The National Traffic Signal Report Card which has confirmed the need for greater attention and investment in traffic signal operations. Improving traffic signal operations pays great dividends and is one of the most cost effective means of reducing congestion. One effective strategy to improving traffic signal operations is regionalizing traffic signal operations; meaning multiple agencies collaborate to leverage their signal timing expertise and resources to provide more consistent and efficient operations both within and across jurisdictional boundaries.
5 Traveler Information
Around The Country
Good Practice Examples
Houston and Chicago
Virginia 511
Southeast Florida
"What's causing this traffic back-up and how much further does the slow traffic last?"
"When is the next bus supposed to come?"
"What's the quickest way to downtown and how much will it cost?"
"When do I need to leave to get to the airport in time?"
Sound familiar? You have certainly heard these questions and perhaps uttered them yourself as congestion has grown on our country's transportation systems. And while there are a number of ways for transportation agencies to deal with the causes of congestion, providing information to the public – motorists, transit users, potential travelers, etc. – can allow them to make better choices and have more control in their travel plans. Real time traveler information gives travelers the opportunity to know what to expect about their routes and make informed travel decisions. Based on traveler information, a traveler can 1) stay the course, 2) alter the time of trip, 3) take an alternate route, or 4) take an alternate mode. Regardless of the decision, the control is back in the traveler's hands.
A changeable message sign displaying real time travel time in Wisconsin.
There are a variety of ways that the public can get traveler information. Most people get traffic information from TV and radio reports that are often fed by private firms that specialize in packaging traffic content. Another growing source for travel information is the 3-digit telephone number, 511, where people can get automated information 24 hours of the day. Highway agencies have traditionally used methods such as dynamic message signs and highway advisory radios to alert motorists to traffic problems. Transit agencies are beginning to provide expected arrival times for buses and trains. And the Internet is becoming the most pervasive method for making real-time information and camera images available to the public.
U.S. DOT is working with the State and local transportation agencies and private firms to expand traveler information capabilities throughout the country. More 511 services are coming online with the goal of having nationwide coverage in 2010. More of the country's most congested cities are beginning to inform motorists of travel times and bus arrivals in real-time. Lessons learned from these experiences are shared with other agencies so that they can use similar methods of informing travelers. Standard ways of representing this information electronically allows private companies to use real-time traveler information and package it for their customers and the public. As people use personalized communication devices and in-vehicle equipment for more information, they can expect real-time traveler information to be available on-demand. When unexpected conditions arise, messages can be sent automatically so travelers can make informed travel decisions. For traveler information, we're striving for all roads, all modes, all the time!
6 Work Zone Safety & Mobility
Ohio - Defining and Implementing a Policy
California
North Carolina - Outreach to Truckers
Work zones seem to be everywhere. And, they always seem to mean traffic delays. The perception is not far from the reality. For example, an estimated 3,110 work zones were present on the National Highway System during the peak summer roadwork season of 2001. This meant that motorists encountered an active work zone one out of every 100 miles and a lane closure every 200 miles. It is not surprising that work zones on freeway account for nearly 24 percent of non-recurring del
ay. In addition, work zone safety is a major concern in the United States, with 1,065 fatalities and more than 40,000 injuries resulting from work zone crashes in 2004 alone.
Travel time reliability is also a key factor associated with work zones, with travelers reporting being frustrated with the delays and unexpected road conditions caused by work zones. This is particularly an issue for road users when a project is in progress but no work appears to be going on for days at a time, yet congestion and delays continue to occur.
An image of a work zone with back up traffic.
Traffic volumes and congestion are increasing, but little corresponding growth in road miles is happening. Many of the Nation's highways are approaching middle age, requiring additional construction and repair, and thus more work zones. Increasingly, construction is taking place while traffic continues to flow on the facility undergoing repair, which applies great pressure on contractors to compress schedules, finish projects early, and perform work art night while maintaining safety and quality.
These trends pointed to a strong need for updating the Federal regulations governing safety and mobility in work zones. The USDOT responded by publishing a new Work Zone Safety and Mobility Rule in September 2004. The updated Rule provides a decision-making framework for considering the broader safety and mobility impacts of work zones across all stages of a project. It also facilitates the implementation of appropriate strategies to help manage those impacts. Compliance with the updated rule is required by October 12, 2007.


 A tour of the WSDOT facility, located at Dayton, Shoreline north of Seattle, was kindly provided by Matt Beaulieu. The centre of operations houses the extensive CCTV system to process traffic images from around the Seattle region, covering about 110 miles of Puget Sounds highways. The images are monitored by the centre staff as well as being fed to at least seven local TV stations. The live CCTV feeds are used in broadcast travel information as well as a dedicated University channel which has 24 hour a day broadcasting solely for travel information. The only condition laid down by WSDOT is that they are given the credit for the images broadcast and this is generally adhered to.
 More than 3,000 inductive detection loops installed around the freeways are used to calculate congestion levels, the same method that exists around Nottinghamshire, but in this case data is fed into a custom written piece of software to generate a graphical congestion map - the same map that is published on the Internet (see earlier this section). Visually, the map is easy to use, and an impression of the state of the entire freeway around Puget Sound can be quickly digested. The schematic map was developed using a wire-frame computer drawing of the road network and the software (written in the "C" programming language) scanning the congestion levels then shades areas of the map different colours for different levels of traffic flow. The Control Centre's display of the map also includes icons for ramp meters and other highway equipment and acts more as a geographical information system including fault status of the various equipment out on the street. We had researched the same congestion map whilst in Nottingham and the visit here provided a good insight as to how it was actually produced and valuable steps forward in producing a similar map for Nottingham.


 Other aspects of the discussion focused on the use of radio stations and television companies to broadcast traffic and travel information. In the U.S. this is heavily sought after information and therefore obviously classifies as prime time with all the revenue implications that go with it. Again CCTV traffic images are fed live to the TV stations who appear more than keen to broadcast them as an enhancement to their other travel and weather information services. Broadcast traffic news is frequent during the main commuter hours with bulletins as often as every ten minutes. A full time University TV channel also exists and is dedicated to TTI. This incorporates CCTV feeds, congestion maps and highway speeds.